
- Course
Geospatial Mapping with D3 v5
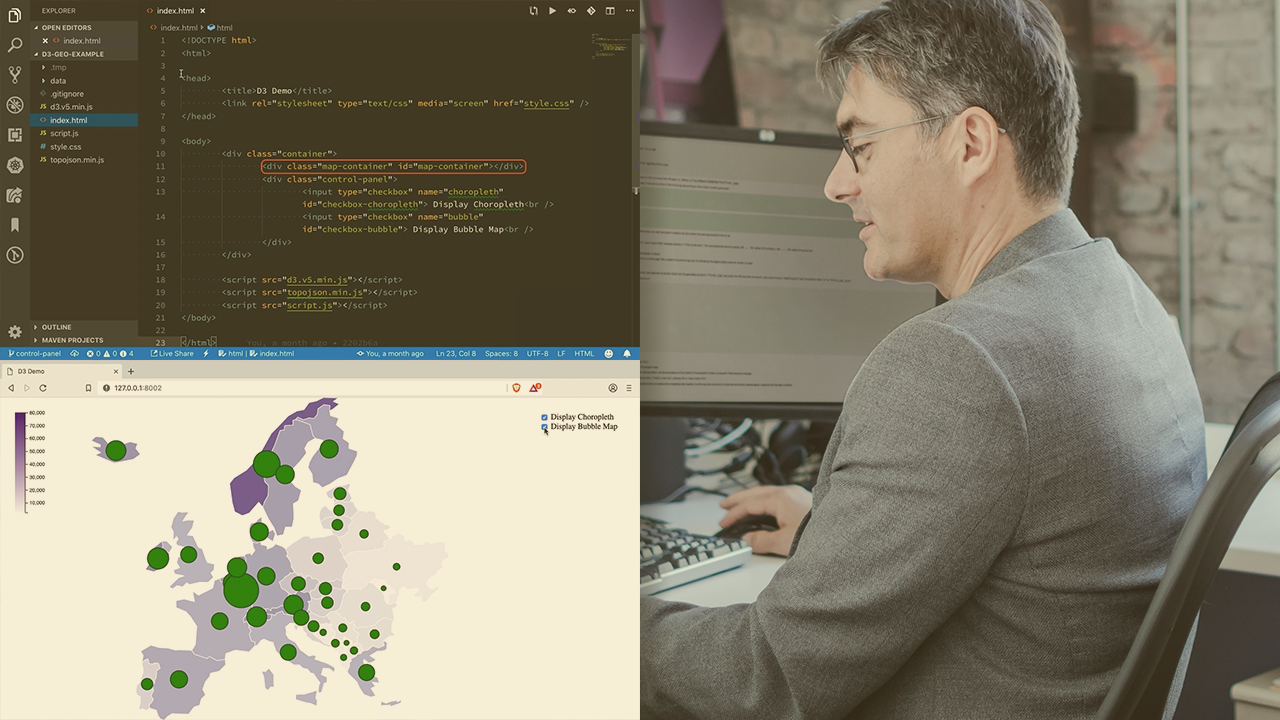
Learn how to create interactive geospatial visualizations that run on all popular browsers. This course will teach you how to use the D3 library to render maps using openly available data, and draw beautiful visualizations on top of them.
Intermediate
- Course
Geospatial Mapping with D3 v5
Learn how to create interactive geospatial visualizations that run on all popular browsers. This course will teach you how to use the D3 library to render maps using openly available data, and draw beautiful visualizations on top of them.
Intermediate
Get started today
Access this course and other top-rated tech content with one of our business plans.
Try this course for free
Access this course and other top-rated tech content with one of our individual plans.
This course is included in the libraries shown below:
- Data
What you'll learn
Conventional charts like bar charts or pie charts serve their purpose well when visualizing conventional data, but are sorely lacking when trying to represent geographically significant data, like population, GDP per capita, or capital cities of a country. In this course, Geospatial Mapping with D3, you will gain the ability to build your own geospatial visualizations that can run in any popular browser. First, you will learn all about the open standards used for representing maps, such as GeoJSON. Next, you will discover how to leverage D3 to draw maps using these standards. Finally, you will explore how to draw dazzling visualizations on top of your map, and make them interactive. When you are finished with this course, you will have the skills and knowledge of the D3 geospatial library needed to build you own maps and visualizations.
Geospatial Mapping with D3 v5
Intermediate
Soham is a full stack developer with experience in building large scale web applications and services for clients across the globe.
