
- Course
Getting Started with D3
This course will teach you how to use D3 to tame your data, and how to use different data visualization tools to communicate to your users.
Intermediate
- Course
Getting Started with D3
This course will teach you how to use D3 to tame your data, and how to use different data visualization tools to communicate to your users.
Intermediate
Get started today
Access this course and other top-rated tech content with one of our business plans.
Try this course for free
Access this course and other top-rated tech content with one of our individual plans.
This course is included in the libraries shown below:
- Data
What you'll learn
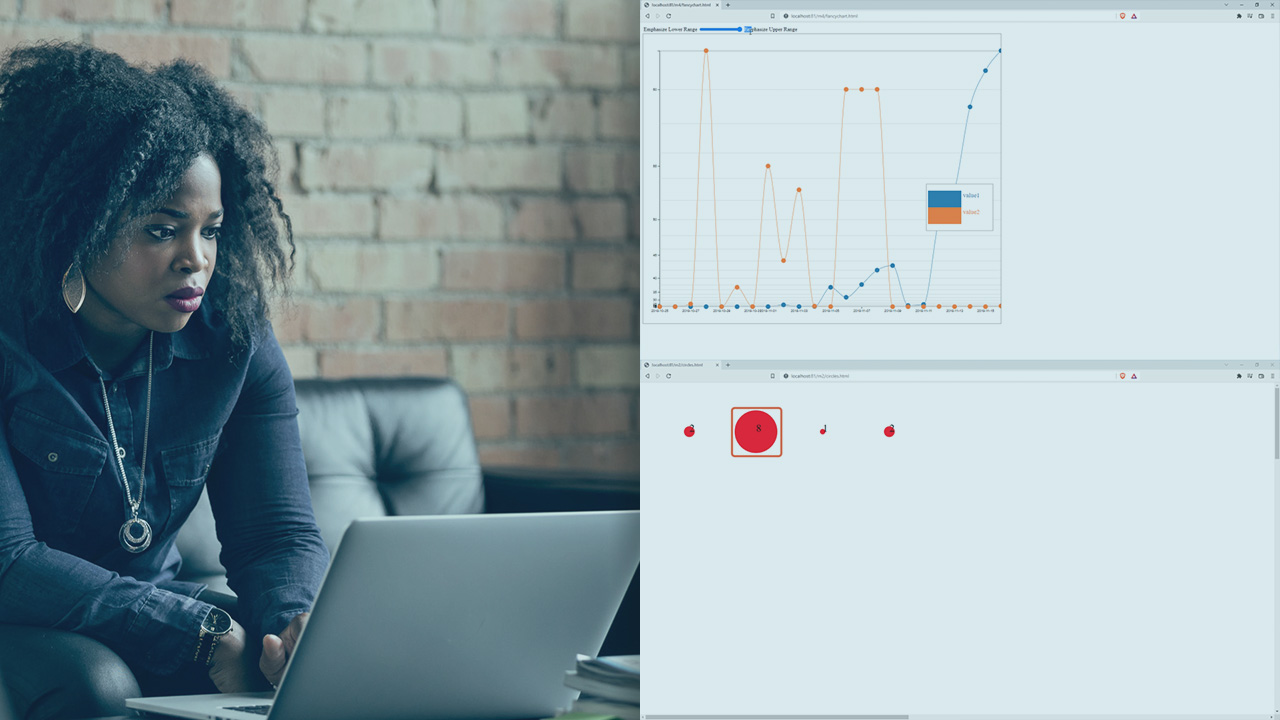
D3 is a breakthrough visualization library for creating compelling displays for your data. It is high-level enough to be comprehensible and effective to work with, and low-level enough to give you very fine control over what’s going on. In this course, Getting Started with D3, you’ll learn how to work with the D3 API. First, you’ll explore how D3 delivers its content with SVG. Next, you’ll discover how to create complex but comprehensible line charts. Finally, you’ll learn how to work with other chart types and make your visualizations interactive. When you’re finished with this course, you’ll have the skills and knowledge of working with D3 to communicate effectively with data.
Getting Started with D3
Intermediate
Table of contents
-
Introduction | 3m 41s
-
Demo: Getting Set up with D3 | 1m 51s
-
Demo: Setup, Part II | 2m 15s
-
Unpacking Hello World | 2m 40s
-
Demo: Understanding SVG | 1m 3s
-
Demo: Data as Circles | 5m 36s
-
Transformation | 1m 41s
-
Demo: Data as Circles, Part II | 2m 20s
-
Demo: Convert to a Bar Chart | 1m 11s
-
Demo: Draw Area-proportional Circles | 1m 4s
-
SVG Coordinates and Transforms | 1m 51s
-
Transform Origins | 1m 12s
-
Demo: SVG Coordinates and Transforms | 3m 52s
-
Getting Started with D3 and Data | 1m 53s
-
Summary | 1m 13s
Chris B. Behrens is a writer, speaker and software developer, specializing in DevOps. He has been a developer and architect for more than twenty years focusing on small to medium size companies and the development changes they face.
