
- Course
Creating Interactive Dashboards with Google Charts
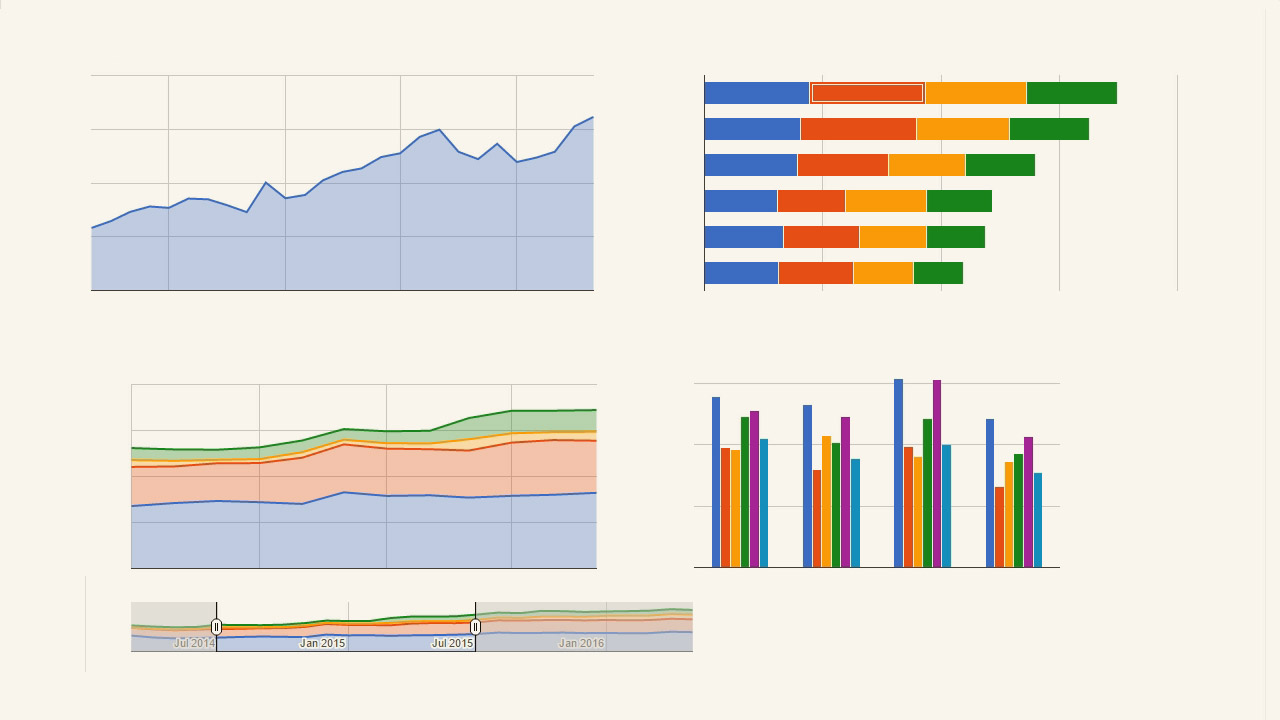
This course will show you how to create an interactive web dashboard using Google Charts and JavaScript, including using customized HTML tooltips, drilling down into data, using filter controls to restrict the data charted, and much more.
Intermediate
- Course
Creating Interactive Dashboards with Google Charts
This course will show you how to create an interactive web dashboard using Google Charts and JavaScript, including using customized HTML tooltips, drilling down into data, using filter controls to restrict the data charted, and much more.
Intermediate
Get started today
Access this course and other top-rated tech content with one of our business plans.
Try this course for free
Access this course and other top-rated tech content with one of our individual plans.
This course is included in the libraries shown below:
- Core Tech
What you'll learn
Web dashboards are tremendously helpful; they give immediate access to timely data and are often displayed in a way that reveals new insights. In this course, Creating Interactive Dashboards with Google Charts, you'll learn how to use the free JavaScript framework called Google Charts to create powerful, interactive web dashboards. The dashboard you'll create will include several different types of interactivity, from detailed tooltips that contain secondary charts, to popups that show drill-down details, to filter controls that allow the user to control which data series are charted over which range. Beyond that, you will explore different layout approaches, including responsive design so the dashboard is usable from a phone or a tablet. By the time the course is complete, you'll know much more about what you need to create a powerful and attractive dashboard with lots of useful interactive features.
Creating Interactive Dashboards with Google Charts
Intermediate
Greg Sommerville is an experienced software developer who has worked in a wide variety of business domains, including health care research, medical devices, enterprise-level software ordering and licensing, and online banking. He specializes in web and mobile development.
