
- Course
Java SE Performance with JMeter
This course will teach you how to use JMeter and other tools to troubleshoot performance problems of Java applications.
Advanced
- Course
Java SE Performance with JMeter
This course will teach you how to use JMeter and other tools to troubleshoot performance problems of Java applications.
Advanced
Get started today
Access this course and other top-rated tech content with one of our business plans.
Try this course for free
Access this course and other top-rated tech content with one of our individual plans.
This course is included in the libraries shown below:
- Core Tech
What you'll learn
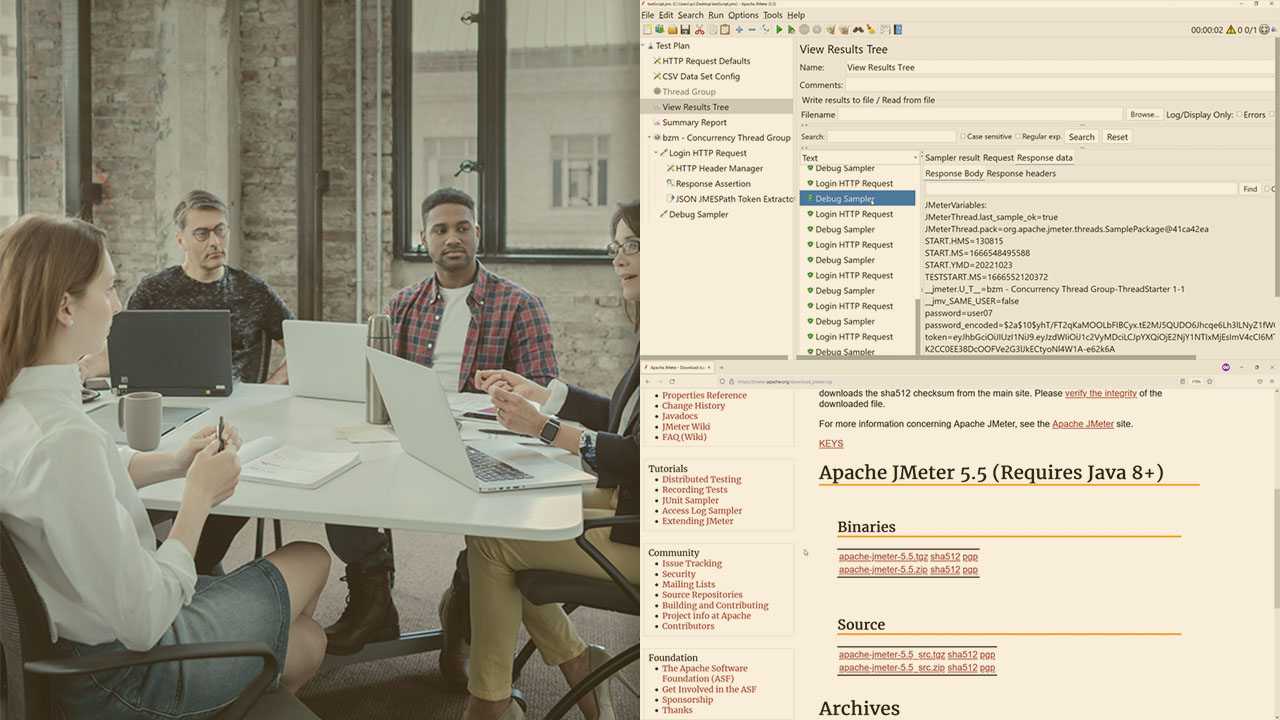
Most tutorials and courses about JMeter show how to create a script to do a performance test and don’t go beyond that. But, how do you establish a performance baseline? How do you monitor resources like CPU and memory consumption? How do you use thread and heap dumps, in addition to JMeter, to identify and solve performance problems? In this course, Java SE Performance with JMeter, you’ll learn to use JMeter and other open-source tools to troubleshoot performance problems of Java applications. First, you’ll explore the features of JMeter and how you can use this tool to generate test data and a script to put your application under load. Next, you’ll discover how to establish a performance baseline that will help you know if your application is scalable. Finally, you’ll learn how to use tools and techniques such as agents, thread, and heap dumps to identify and solve performance problems. When you’re finished with this course, you’ll have the skills and knowledge of JMeter and related tools needed to test the performance of your Java applications.
Java SE Performance with JMeter
Advanced
Table of contents
Esteban Herrera has more than twelve years of experience in the software development industry. Having worked in many roles and projects, he has found his passion in programming with Java and JavaScript. Nowadays, he spends all his time learning new things, writing articles, teaching programming, and enjoying his kids.
