
- Course
Matplotlib 3 for Data Visualization and Python: Getting Started
Get up to speed with the basics of data visualization using Python and Matplotlib. This course will explore how to create and customize charts and graphs to tell the story behind the data. It will also touch on how to add some interactive components.
Intermediate
Get started today
Access this course and other top-rated tech content with one of our business plans.
Try this course for free
Access this course and other top-rated tech content with one of our individual plans.
This course is included in the libraries shown below:
- Data
What you'll learn
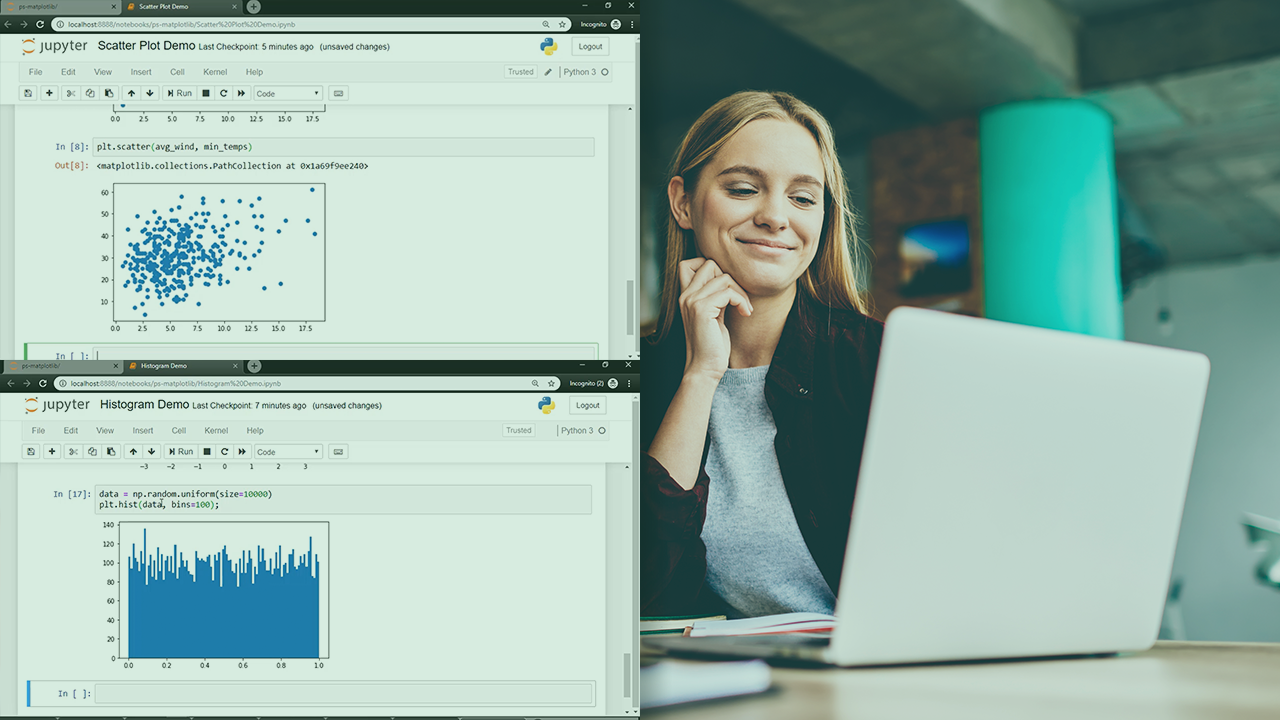
Matplotlib is a Python package for creating visualizations in order to get the most value out of your data. In this course, Matplotlib 3 for Data Visualization and Python: Getting Started, you’ll learn the foundations of Matplotlib to reveal the story behind the data. First, you’ll explore basic visualizations such as bar and pie charts. Next, you’ll discover how to customize these with color, text, and layouts. Finally, you’ll learn how to add some 'sizzle' with animations and interactivity and embed those visualizations in a number of different applications. When you’re finished with this course, you’ll have the skills and knowledge of Matplotlib needed to create data visualizations with Python.
Matplotlib 3 for Data Visualization and Python: Getting Started
Intermediate
Douglas Starnes is a polyglot ninja and tech community influencer in the Memphis area making stuff that works on more than just the web. He is a co-director of the Memphis Python User Group and a board member of the Memphis .NET User Group.
