
- Course
Pandas Playbook: Visualization
Pandas is one of the most popular data analysis libraries for Python. In this course, you will learn how to create a wide range of plots for your data, and how to customize them to make them both attractive and informative for your audience.
Beginner
- Course
Pandas Playbook: Visualization
Pandas is one of the most popular data analysis libraries for Python. In this course, you will learn how to create a wide range of plots for your data, and how to customize them to make them both attractive and informative for your audience.
Beginner
Get started today
Access this course and other top-rated tech content with one of our business plans.
Try this course for free
Access this course and other top-rated tech content with one of our individual plans.
This course is included in the libraries shown below:
- Data
What you'll learn
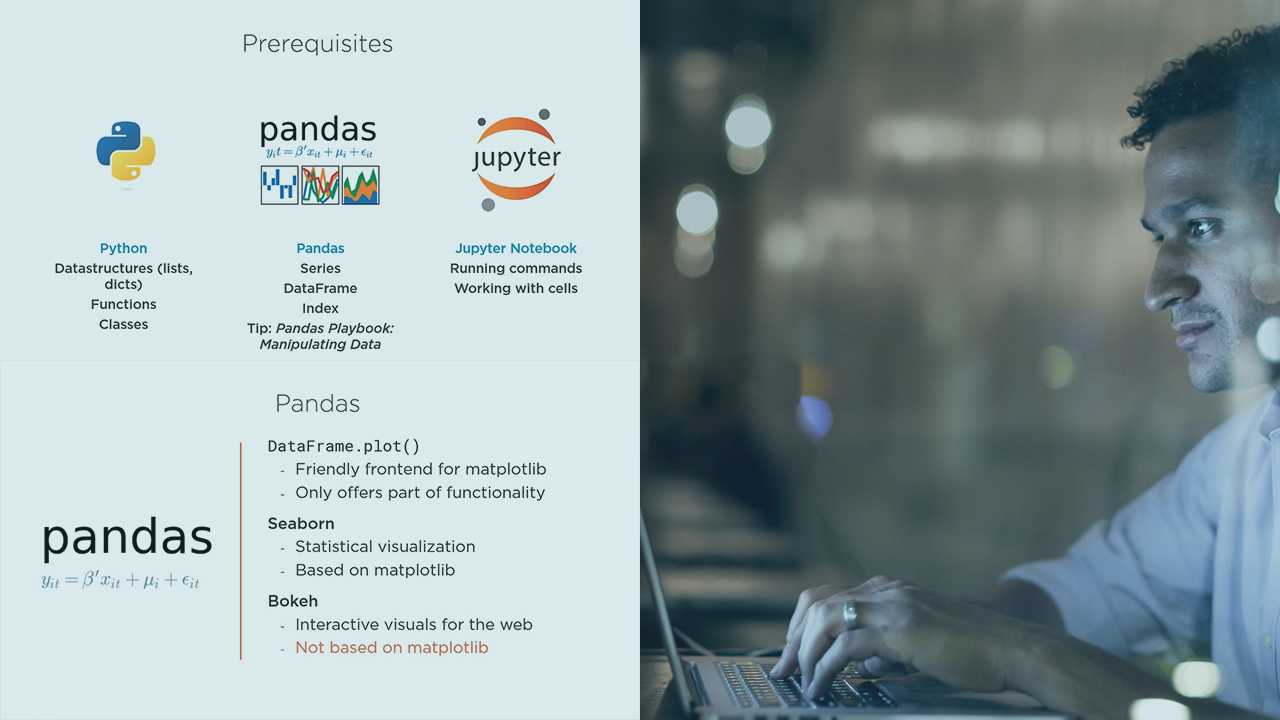
At some point when you are working with a dataset, you will want to make the properties of that dataset visible in a graphical way. This is a core skill for every data scientist or data engineer. In this course, Pandas Playbook: Visualization, you’ll learn how to create a large variety of beautiful plots with Pandas, one of the most popular data analysis libraries for Python. First, you'll learn the very basics of plotting with pandas, learning how to prepare your dataset for plotting, and how to create common plots like a bar, line, and scatter plot. Next, you will explore matplotlib, the Python library that generates the actual graphics, how this interacts with Pandas, and how to use it correctly. Then, you will go more in-depth and learn about all the ways to customize your plots, including line styles, colors and themes, customizing axes and legends, creating interactive plots, and much more. Finally, you will see a short overview of two other visualization libraries that can be used with Pandas: Seaborn, which is focused on statistical plotting, and Bokeh, which can create interactive visuals for the web. After watching this course, you’ll have a deep understanding of all possible ways you can use Pandas to visualize your data. You'll know how to write efficient and clear code that creates beautiful plots, following best practices. This course will also make you more proficient in exploring datasets and communicating your results with others.
Pandas Playbook: Visualization
Beginner
Table of contents
After years of working in software development, Reindert-Jan Ekker switched to teaching programmers in 2010 and never looked back. He authors Pluralsight courses and teaches classes about Python, data science, devops (among others). Even though he squeezes some development jobs in here and there, teaching is his real passion and he is looking forward to share this passion with you.
