- Course
Play by Play: Debugging and Troubleshooting Salesforce Lightning Components
In this course, you’ll learn how the Lightning Component Framework from Salesforce enables developers to create rich Single Page Applications and custom components for Lightning Experience and Salesforce Mobile using HTML, CSS, and JavaScript.
Get started today
Access this course and other top-rated tech content with one of our business plans.
Try this course for free
Access this course and other top-rated tech content with one of our individual plans.
This course is included in the libraries shown below:
- Core Tech
What you'll learn
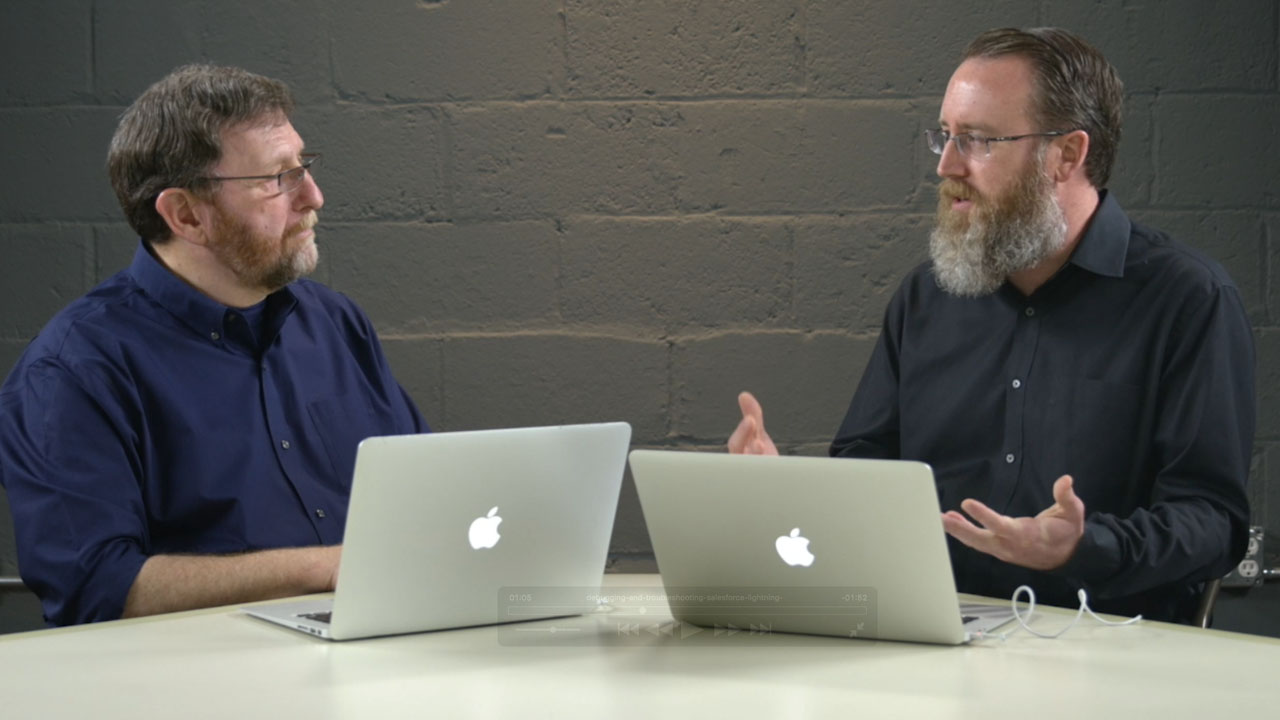
Play by Play is a series in which top technologists work through a problem in real time, unrehearsed, and unscripted. In this course, Play by Play: Debugging and Troubleshooting Salesforce Lightning Components, Mike Topalovich and Don Robins demonstrate how you would guide a team around development best practices for debugging and troubleshooting Lightning Components. Learn whats under the hood of the Salesforce “Single Page Application” (or SPA) architecture, deep dive into troubleshooting CSS style and class hierarchies, and creative debugging approaches. By the end of this course, you’ll have gained some valuable perspective and insight that can help you master the craft of quickly resolving common issues and exceptions, increasing your productivity, and allowing you to stay focused on component delivery.

