
- Course
Plotting Data with Pandas
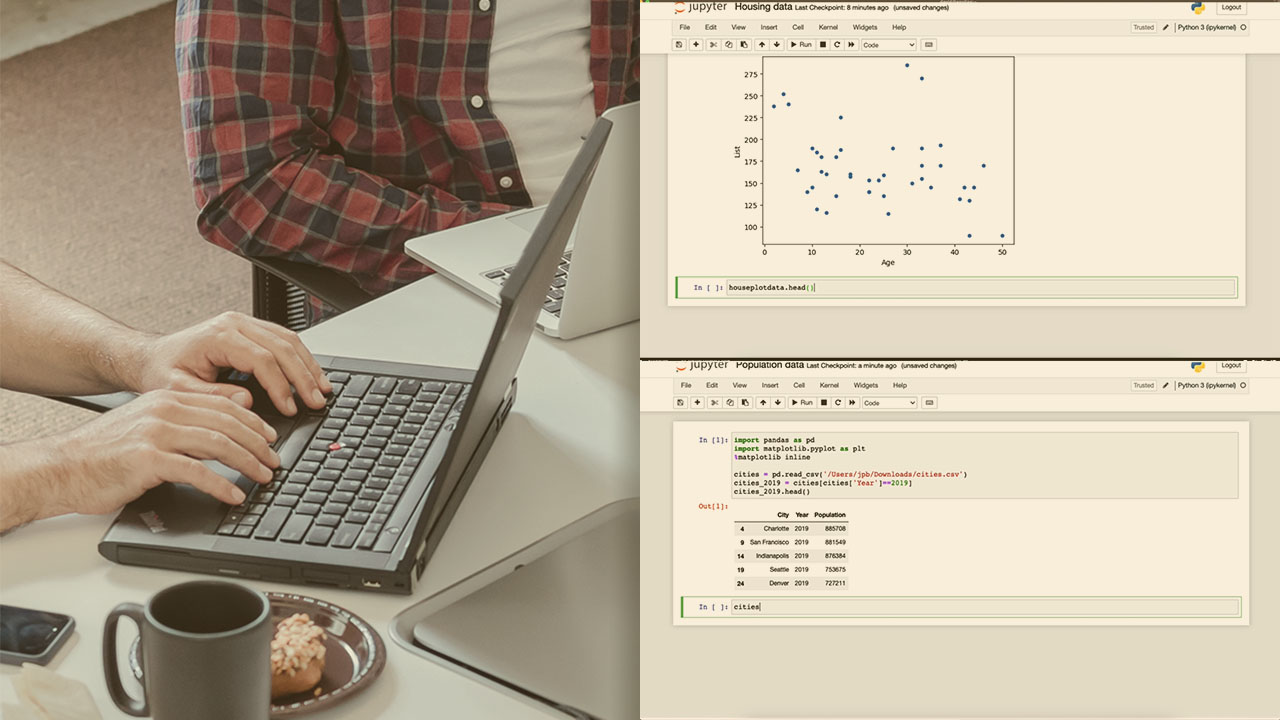
This course will introduce you to basic data plotting functions in Python that will help you to create clear and dynamic data visualizations to communicate analysis and findings with various audiences.
Beginner
- Course
Plotting Data with Pandas
This course will introduce you to basic data plotting functions in Python that will help you to create clear and dynamic data visualizations to communicate analysis and findings with various audiences.
Beginner
Get started today
Access this course and other top-rated tech content with one of our business plans.
Try this course for free
Access this course and other top-rated tech content with one of our individual plans.
This course is included in the libraries shown below:
- Data
What you'll learn
When performing data analysis, the ability to visualize your data is extremely important for both the analysis process itself as well as for sharing your results with others.
In this course, Plotting Data with Pandas, you’ll learn how to use basic plotting functions in Python to create data visualizations.
First, you’ll be introduced to Matplotlib, a built-in Python plotting library, and some of its fundamental features.
Next, you’ll discover methods about preparing your data for visualization and how to use it to create basic plots.
Finally, you’ll explore how to use Python to customize your visualizations.
When you’re finished with this course, you’ll have the knowledge needed to prepare effective data visualizations that will allow you to clearly communicate results and findings from your data analysis work with a wide variety of audiences.
Plotting Data with Pandas
Beginner
Table of contents
Jason Browning is a data and analytics professional with extensive experience in both the public and private sector. As a Tableau Desktop Certified Professional, Jason loves to build data visualizations that both inform and inspire.
