
- Course
Pygal 2: Python Data Playbook
This course covers the important aspects of building visualizations in Pygal, using styles and configurations to govern chart behavior, rendering and exporting to SVG and other specialized formats, and serving Pygal visualizations in web content.
Beginner
- Course
Pygal 2: Python Data Playbook
This course covers the important aspects of building visualizations in Pygal, using styles and configurations to govern chart behavior, rendering and exporting to SVG and other specialized formats, and serving Pygal visualizations in web content.
Beginner
Get started today
Access this course and other top-rated tech content with one of our business plans.
Try this course for free
Access this course and other top-rated tech content with one of our individual plans.
This course is included in the libraries shown below:
- Data
What you'll learn
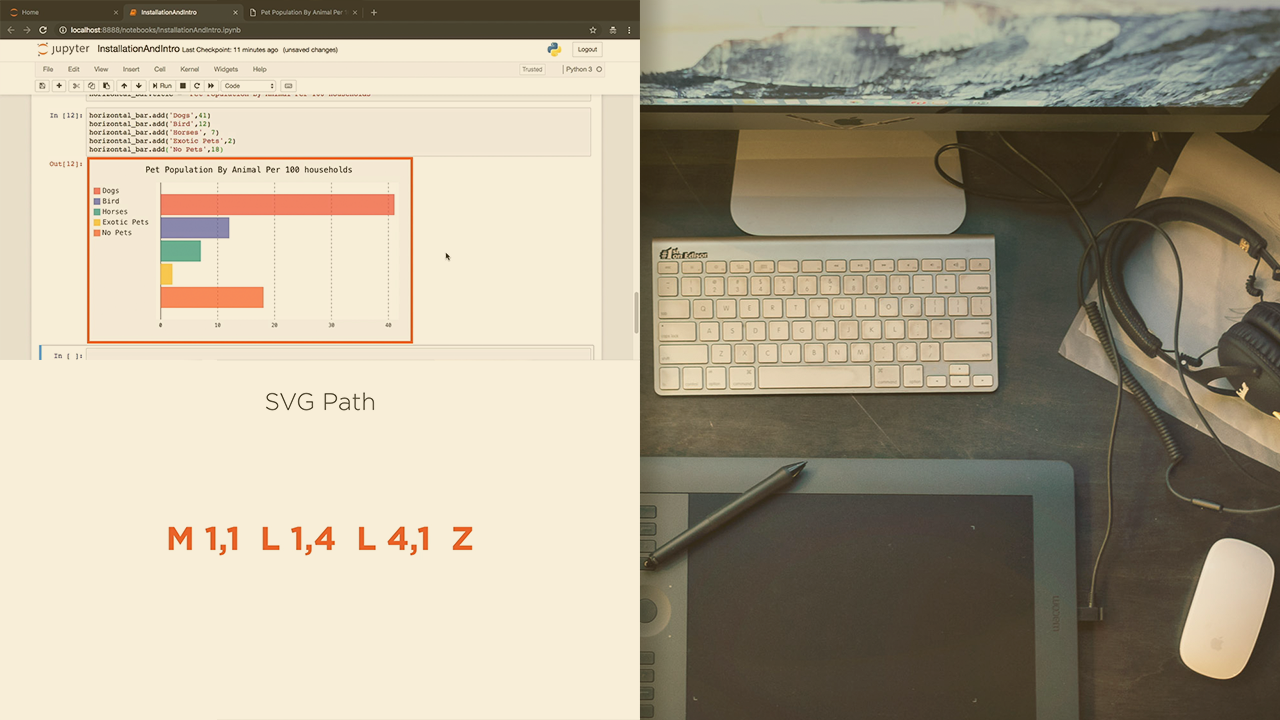
Vector image formats such as SVG possess many important advantages over scalar formats such as PNG and JPEG. Using SVG, you can build high-quality, compact visualizations that render on low-resolution devices and that can be scaled, zoomed, and moved without distortion.
In this course, Pygal: Python Data Playbook, you will gain the ability to construct an array of visualizations and render them to SVG format using Pygal.
First, you will learn the advantages of working with Pygal for building SVGs and understand the niche that Pygal occupies relative to other visualization packages such as Matplotlib, Seaborn, Bokeh, and Plotly. Next, you will discover how to build an array of visualizations in Pygal, from in-memory as well as file data. You will then construct a visualization including simple charts such as Line, Tree, and Bar graphs, as well as specialized types like TreeMaps and Sparklines. You will understand the different types of Styles and Configurations that can be used to govern chart appearance. You will work with built-in, parametric, and custom styles, as well as Chart, Serie, and Value configurations.
Finally, you will explore how to render Pygal visualizations to a range of image and non-image formats, including XML element trees and base64 encoded formats for online transfer. You will round out the course by building a web application using the Flask microframework in order to render and serve Pygal charts.
When you are finished with this course, you will have the skills and knowledge of building and rendering visualizations in Pygal needed to effectively harness the many advantages of the Scalable Vector Graphics format.
Pygal 2: Python Data Playbook
Beginner
Table of contents
An engineer at heart, I am drawn to any interesting technical topic. Big Data, ML and Cloud are presently my topics of interest.
