Beginning Data Visualization with R
Course info


Course info


Description
R is a popular open-source programming language for data analysis. Its interactive programming environment and data visualization capabilities make R an ideal tool for creating a wide variety of data visualizations. In this course, you will learn how to answer questions about your data by creating data visualizations with R.
Section Introduction Transcripts
Course Overview
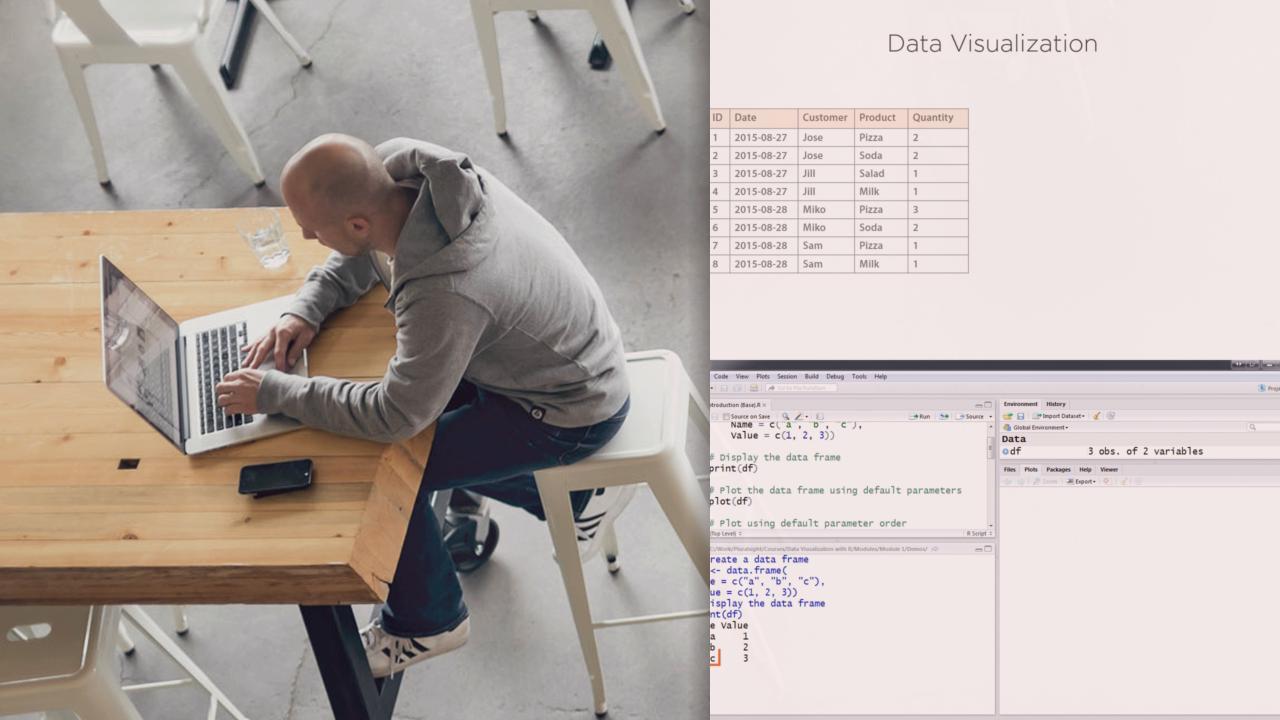
Hi, I'm Matthew Renze with Pluralsight, and welcome to Beginning Data Visualization with R. R is a very popular programming language for data analysis and data visualization. Its interactive programming capabilities, powerful data analysis tools, and data visualization capabilities make it many expert's first choice for creating professional data visualizations. In this course we'll learn how to create and interpret data visualizations using the three main plotting systems in R, that is the base graphic system, lattice, and ggplot2. In addition, we'll learn about best practices for creating professional data visualizations for a wide audience. As an overview of this course, first we'll learn the basics of creating data visualizations with the three a main plotting systems in R. Next we'll learn how to create and interpret data visualizations that involve either one or two categorical or numeric variables. Finally, we'll move down the basics and learn about more advanced data visualizations, best practices for creating professional data visualizations, and we'll look at a few alternatives to using R to create our data visualizations. By the end of this course you have the skills necessary to create and interpret a variety of data visualizations using all three of the main plotting systems in R. Before beginning the course you should be familiar with the basic syntax of R and the RStudio integrated development environment. If you do not meet these prerequisites please feel free to watch module one of my Exploratory Data Analysis with R course first. This module will cover all of the basics. So please join us today at Pluralsight and learn how to transform your data into actual insight with Beginning Data Visualization with R.