
- Course
Understand Revit Data Through Color
This course will explore methods to convey model information through the use of simple graphics and how they integrate into a project's workflow, from schematic designs program diagramming, to creating code diagrams for Construction Documents. Software required: Revit.
Beginner
Get started today
Access this course and other top-rated tech content with one of our business plans.
Try this course for free
Access this course and other top-rated tech content with one of our individual plans.
This course is included in the libraries shown below:
- Core Tech
What you'll learn
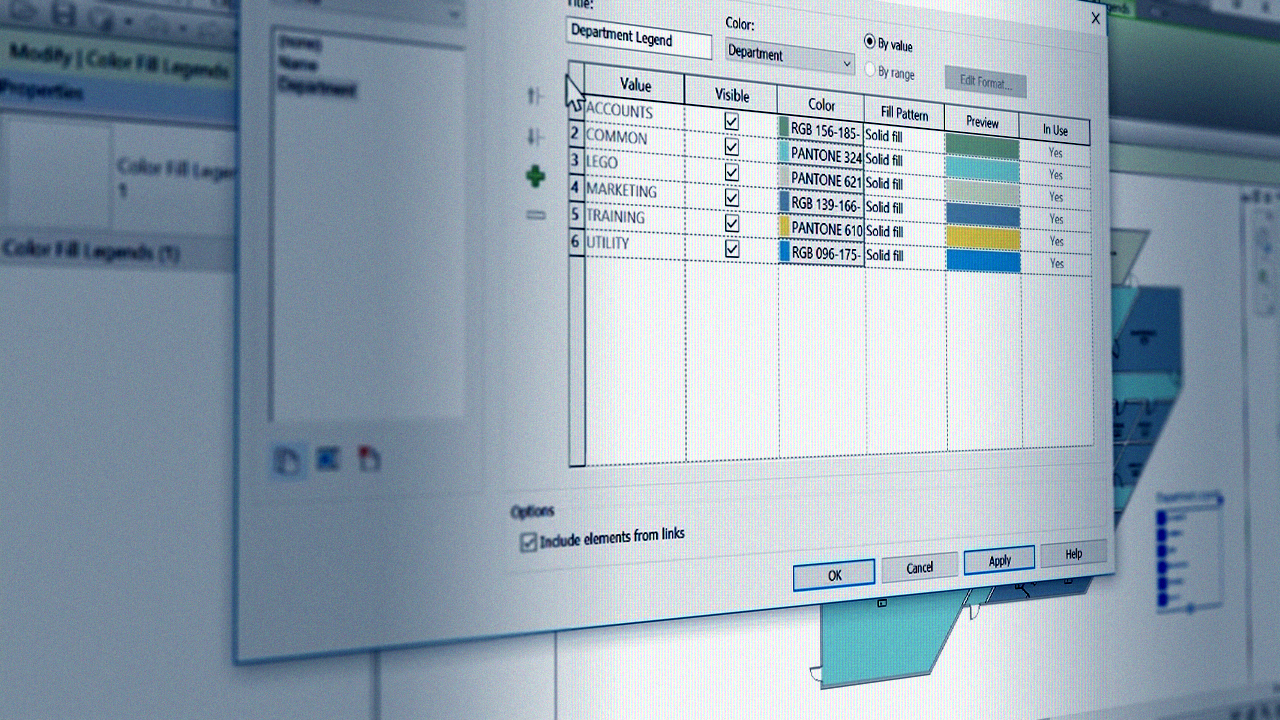
Displaying information to clients and other project stake holders in an easily understandable manner can be problematic. The best way to convey this information is through the use of simple graphics. In this course, Understand Revit Data Through Color, you'll see how to use Revit to create graphics from data in a model. First, you'll start with exploring several different methods and how they integrate within the workflow of a project, from schematic design program diagramming, to creating code diagrams for the authorities having jurisdiction. Next, you'll get to see how to use area and room data to add patterns, as well as using visibility graphics to add patterns. Finally, you'll get to use Materials System Families and Mass Objects to Color views to understand information within the model. When you're finished with this course, you'll have an understanding of how model managers can use these methods to perform model checks on the model to verify that it's meeting the project's design criteria. Software required: Revit.
Understand Revit Data Through Color
Beginner
Mathew Miller has been in the AEC industry for over 25 years. Starting as a CAD drafter, he's moved his way up to be a Project Architect and the BIM systems manager for SMPC Architects in Albuquerque, New Mexico. He received an associates degree of Applied Architecture from the Denver Institute of Technology, and a Bachelor of Arts and a Master of Architecture from the University of New Mexico. He is the Vice President and occasional speaker of the 505 BIM Users Group, and has been writing a blog since 2008.
