
- Course
Splunk 9: Building Reports, Dashboards, and Alerts
Have you been wanting to visualize and use your data better within Splunk? This course will give you the knowledge and tools to help you learn more about this SIEM, the reports and dashboard capabilities of it, and how to alert on your data.
Beginner
Get started today
Access this course and other top-rated tech content with one of our business plans.
Try this course for free
Access this course and other top-rated tech content with one of our individual plans.
This course is included in the libraries shown below:
- Core Tech
What you'll learn
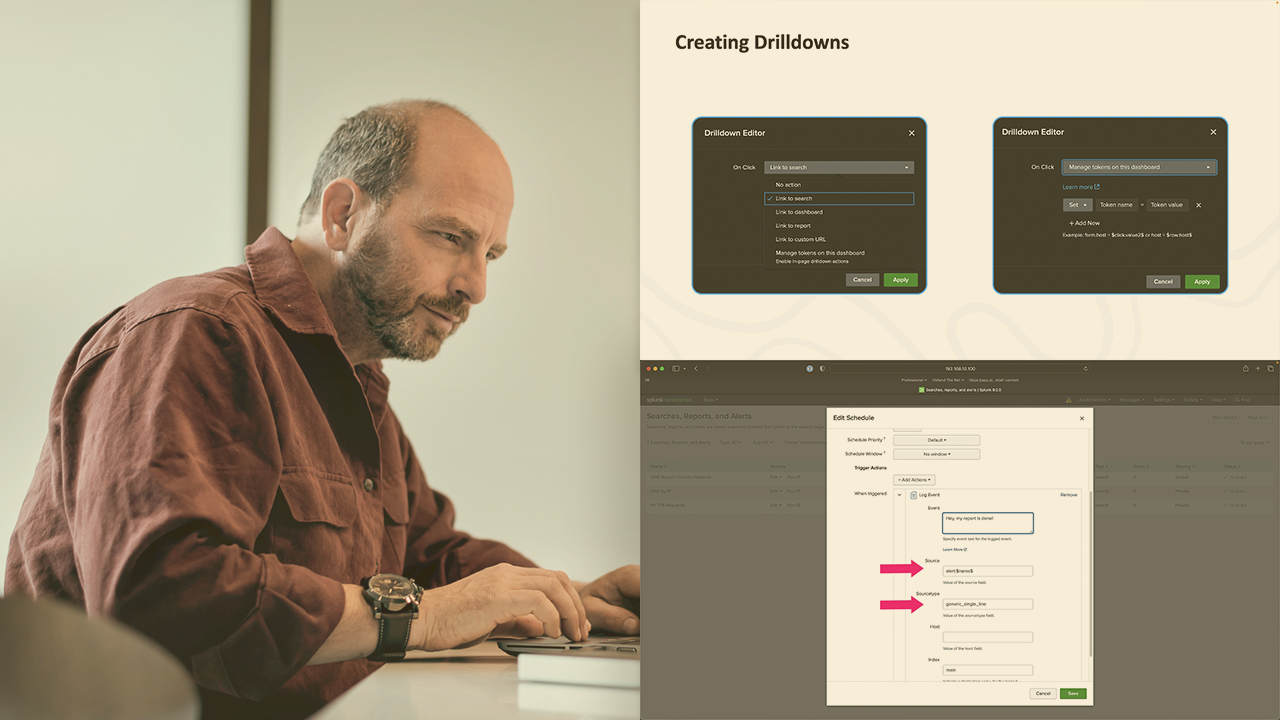
Visualizing data is key to many business operations today. Splunk’s reports and dashboards create the ability to visualize your data in customizable ways. In this course, Splunk 9: Building Reports, Dashboards, and Alerts, you will learn everything that you need to know about Splunk reports and dashboards, as well as how to alert on the data. First, you’ll learn about Splunk reports and how to build them. Then, you’ll learn how to create dashboards and improve their performance. Finally, you’ll learn how to create and use alerts for the data in Splunk. By the time you’re finished with this course, you’ll be able to step in and visualize your data more effectively.
Splunk 9: Building Reports, Dashboards, and Alerts
Beginner
Table of contents
Joe is a Network Consulting Engineer and has worked in the IT industry since 2010. He has experience in teaching and mentoring IT professionals in both DoD environments and in the civilian sector, in both the networking and IT security fields.
