
- Course
Summarizing Data and Deducing Probabilities
This course covers the most important aspects of exploratory data analysis using different univariate, bivariate, and multivariate statistics from Excel and Python, including the use of Naive Bayes' classifiers and Seaborn to visualize relationships.
Beginner
Get started today
Access this course and other top-rated tech content with one of our business plans.
Try this course for free
Access this course and other top-rated tech content with one of our individual plans.
This course is included in the libraries shown below:
- Data
What you'll learn
Data science and data modeling are fast emerging as crucial capabilities that every enterprise and every technologist must possess these days. Increasingly, different organizations are using the same models and the same modeling tools, so what differs is how those models are applied to the data. So, it is really important that you know your data well.
In this course, Summarizing Data and Deducing Probabilities, you will gain the ability to summarize your data using univariate, bivariate, and multivariate statistics in a range of technologies.
First, you will learn how measures of mean and central tendency can be calculated in Microsoft Excel and Python. Next, you will discover how to use correlations and covariances to explore pairwise relationships. You will then see how those constructs can be generalized to multiple variables using covariance and correlation matrices.
You will understand and apply Bayes' Theorem, one of the most powerful and widely-used results in probability, to build a robust classifier.
Finally, you will use Seaborn, a visualization library, to represent statistics visually.
When you are finished with this course, you will have the skills and knowledge to use univariate, bivariate, and multivariate descriptive statistics from Excel and Python in order to find relationships and calculate probabilities.
Summarizing Data and Deducing Probabilities
Beginner
Table of contents
-
Version Check | 16s
-
Module Overview | 1m 14s
-
Prerequisites and Course Outline | 1m 31s
-
Understanding Descriptive Statistics | 6m 57s
-
Measures of Central Tendency and Dispersion | 4m 53s
-
Understanding Variance | 2m 44s
-
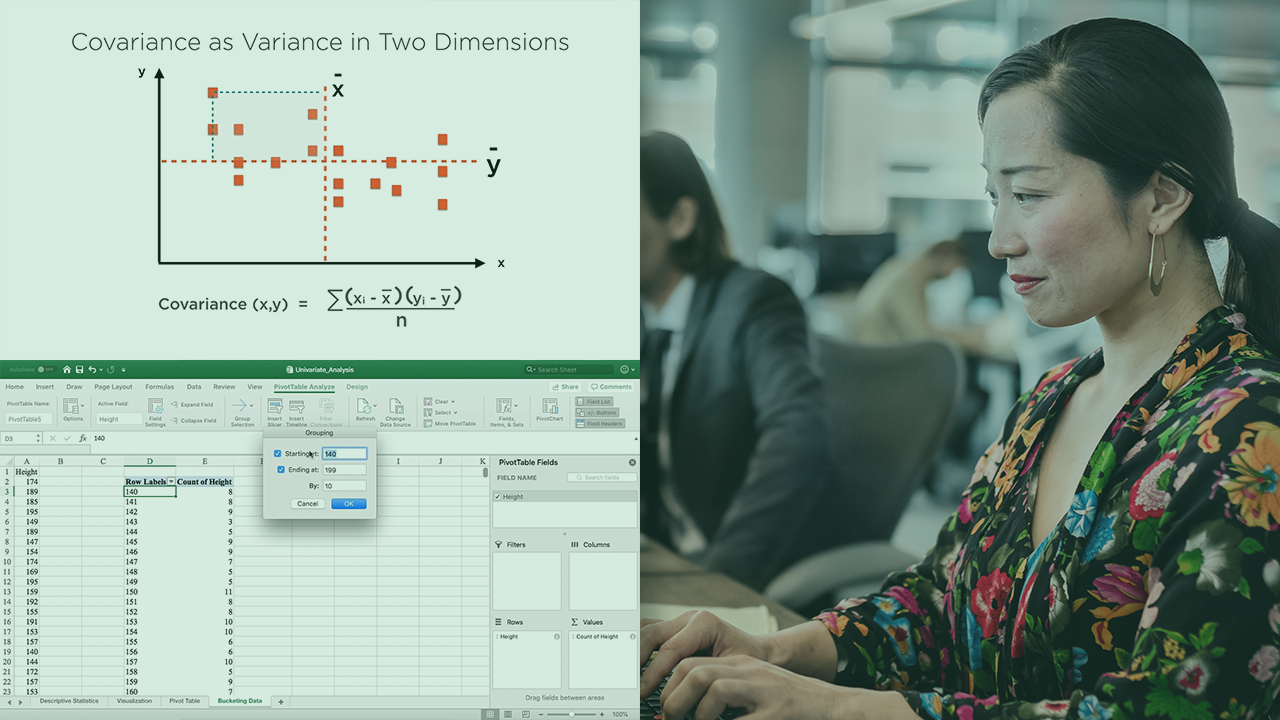
Measuring Relationships Using Covariance | 3m 20s
-
Covariance Matrices and Correlation Matrices | 4m 47s
A problem solver at heart, Janani has a Masters degree from Stanford and worked for 7+ years at Google. She was one of the original engineers on Google Docs and holds 4 patents for its real-time collaborative editing framework.
