- Course
Building Effective Dashboards with Tableau Desktop
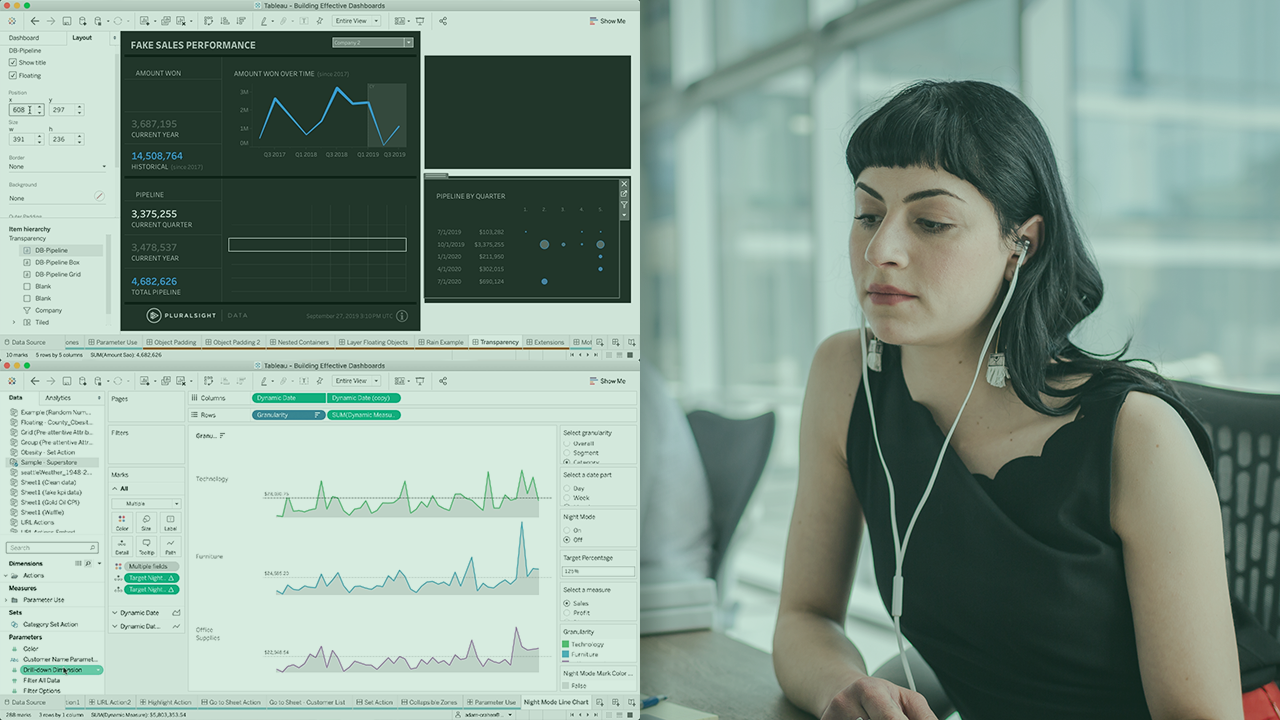
Learn how to bring all your elements together (literally) in this advanced course. You will learn some of the science behind dashboarding and all the technical skills you need to deliver high-quality content for any device in Tableau Desktop.
Get started today
Access this course and other top-rated tech content with one of our business plans.
Try this course for free
Access this course and other top-rated tech content with one of our individual plans.
This course is included in the libraries shown below:
- Data
What you'll learn
Tableau Dashboards can create wonderful visuals for all kinds of data but it's easy for those visuals to lose effectiveness. In this course, Building Effective Dashboards with Tableau Desktop, you will gain the technical knowledge to effectively create and deliver high-quality content. First, you will learn the science behind dashboarding. Next, you will discover how you can enable your end users to interact with your data by using dashboard actions. You will also learn advanced dashboarding techniques like object padding, extensions, and nested layout containers. Finally, you will explore tips and tricks to design for mobile. When you are finished with this course, you will have the skills and knowledge of effectively building dashboards needed to successfully communicate a compelling data story.

