
- Course
Tableau Desktop Specialist - Creating Basic Charts
Tableau is an industry leading data visualization tool. This course will teach you how to build several basic charts in Tableau Desktop.
Beginner
- Course
Tableau Desktop Specialist - Creating Basic Charts
Tableau is an industry leading data visualization tool. This course will teach you how to build several basic charts in Tableau Desktop.
Beginner
Get started today
Access this course and other top-rated tech content with one of our business plans.
Try this course for free
Access this course and other top-rated tech content with one of our individual plans.
This course is included in the libraries shown below:
- Data
What you'll learn
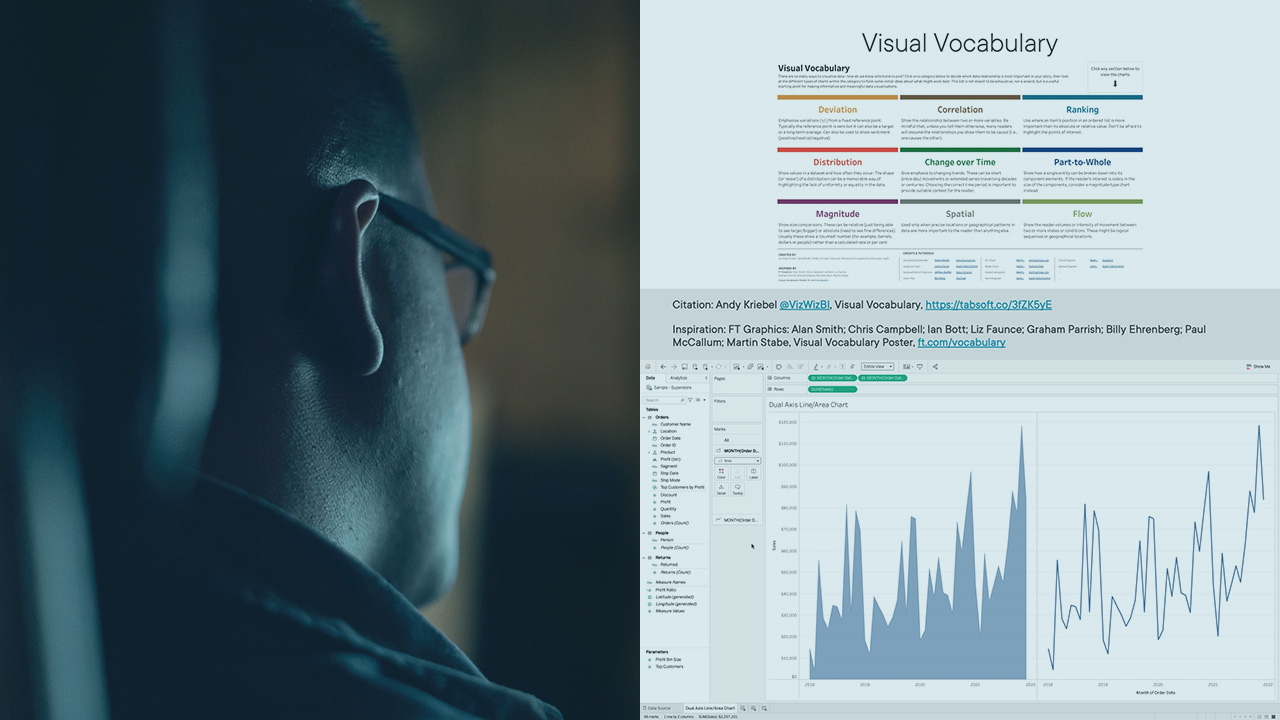
Creating charts is an essential skill for anyone communicating important points of data. In this course, Tableau Desktop Specialist - Creating Basic Charts, you’ll learn to build basic charts to get answers fast. First, you’ll explore how to choose the right chart for your data. Next, you’ll discover the art of dragging and dropping. Finally, you’ll learn how to put these skills to use in several demos. When you’re finished with this course, you’ll have the skills and knowledge of creating basic charts needed to start your data analysis in Tableau Desktop.
Tableau Desktop Specialist - Creating Basic Charts
Beginner
Table of contents
Adam Crahen is the Director of Analytics Practices and Enablement for Pluralsight and also a former Tableau Zen Master. Adam is a creative problem solver specializing in data curation, transformation and visualization with tools like Tableau, SQL, Snowflake, dbt, and Alteryx, etc. His work has been recognized by organizations like Kantar and has been featured by several news organizations around the world. He enjoys sharing his knowledge and passion for data by speaking at conferences, user groups and connecting with the data community.
