
- Course
Using Integrated Analytics in Tableau Desktop
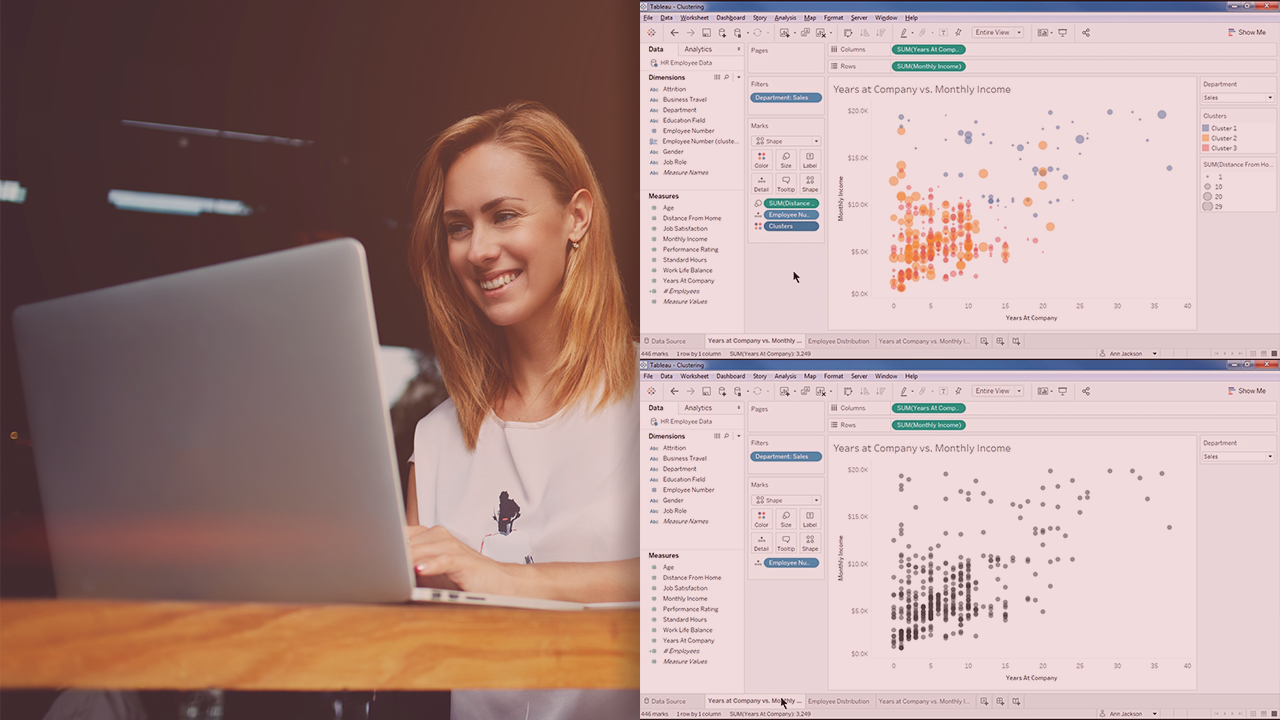
Tableau Desktop is a popular data visualization and analysis tool. In this course, you'll learn how to create and use reference lines, trend lines, forecast time series, and use cluster analysis. You'll also learn the statistics behind the features.
Beginner
- Course
Using Integrated Analytics in Tableau Desktop
Tableau Desktop is a popular data visualization and analysis tool. In this course, you'll learn how to create and use reference lines, trend lines, forecast time series, and use cluster analysis. You'll also learn the statistics behind the features.
Beginner
Get started today
Access this course and other top-rated tech content with one of our business plans.
Try this course for free
Access this course and other top-rated tech content with one of our individual plans.
This course is included in the libraries shown below:
- Data
What you'll learn
At the core of visualizing and analyzing data in Tableau Desktop is a thorough knowledge of its integrated analytics features. In this course, Using Integrated Analytics in Tableau Desktop, you'll learn how to leverage each of these features to produce deeper, more insightful visualizations. First, you'll delve into statistics found in the worksheet summary card that form the foundation of data analysis. Next, you'll discover how to create reference lines, bands, box plots, and confidence intervals and when to use them. Finally, you'll explore advanced analytics including trend lines, forecasting, and clustering to unearth unseen relationships and predict future events. When you're finished with this course, you'll have the skills and knowledge of the integrated analytics features needed to utilize them in your own data analysis. Software required: Tableau Desktop.
Using Integrated Analytics in Tableau Desktop
Beginner
Ann Jackson is a Tableau Zen Master and analytics evangelist at the consulting firm, Jackson Two. Ann is known for her clean design, analytical displays, and commitment to the data community.
