
- Course
Visualizing Data on AWS
Data visualization is an important step for professionals who want to make sense of data for machine learning purposes or even presenting meaningful data to an audience. In this course you will see how to do data visualization using AWS QuickSight.
Beginner
- Course
Visualizing Data on AWS
Data visualization is an important step for professionals who want to make sense of data for machine learning purposes or even presenting meaningful data to an audience. In this course you will see how to do data visualization using AWS QuickSight.
Beginner
Get started today
Access this course and other top-rated tech content with one of our business plans.
Try this course for free
Access this course and other top-rated tech content with one of our individual plans.
This course is included in the libraries shown below:
- Cloud
- Data
What you'll learn
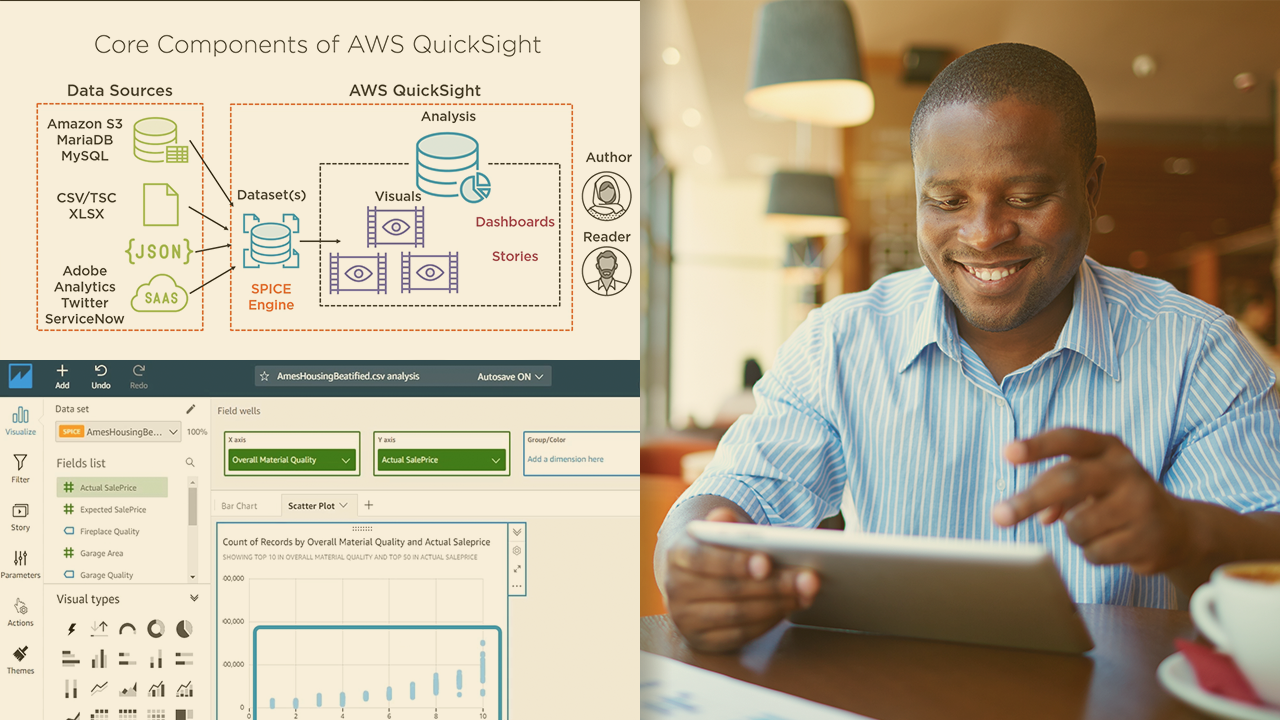
Data visualization is a necessary task for any business professional trying to make sense of numbers, data scientists trying to identify an underlying relationship, or even a C-level executive who wants to visualize rigid reported figures. In this course, Visualizing Data on AWS, you’ll learn how to visualize and quickly make sense of your data. First, you’ll explore the basics of AWS QuickSight. Next, you’ll discover the core components that form AWS QuickSight. Finally, you’ll learn how to visualize your data using different chart types. When you’re finished with this course, you’ll have the skills and knowledge of data visualization needed to perform data visualization.
Visualizing Data on AWS
Beginner
Table of contents
Mohammed Osman is a senior software engineer who started coding at the age of 13. Mohammed worked in various industries, including telecommunication, accounting, banking, health, and assurance. Mohammed's core skillset is a .NET ecosystem with a strong focus on C#, Azure, and Data Science. Mohammed also enjoys the soft-side of software engineering and leads scrum teams. Mohammed runs a blog with the message "Making your code smart and your career smarter." He shares tips and techniques to improve your code and valuable career pieces of advice in his blog.
