Create Quick Table Calculations in Tableau
May 21, 2020 • 8 Minute Read
Introduction
In business intelligence and analytics, it is often necessary to perform quick table calculations. These calculations allow us to quickly apply a common table calculation into the visualization work. Tableau provides a set of pre-computed table calculations that can be used without writing any code. In this guide, you will learn how to create quick table calculations in Tableau.
Data
Quick table calculations are applied to continuous measures and can not be applied on dimensions unless they are converted to the continuous measure type. However, it computes the continuous measure with respect to the addressed dimensions that are part of the view.
This guide will use the Sample Superstore data source available in the Tableau repository.
Creating Calculations
To perform quick table calculation, consider the Order Date variable, with year and quarter as the partition fields, against the Segment variable. The measure you will use is Sales. The scenario involves looking at the quarterly sales of each year across different segments, and then implementing percent of total as a quick table calculation.
To begin, drag Order Date to the Rows shelf and Segment to the Columns shelf. Next, drag the variable Sales to the Text pane in the Marks card. This will generate the following output.
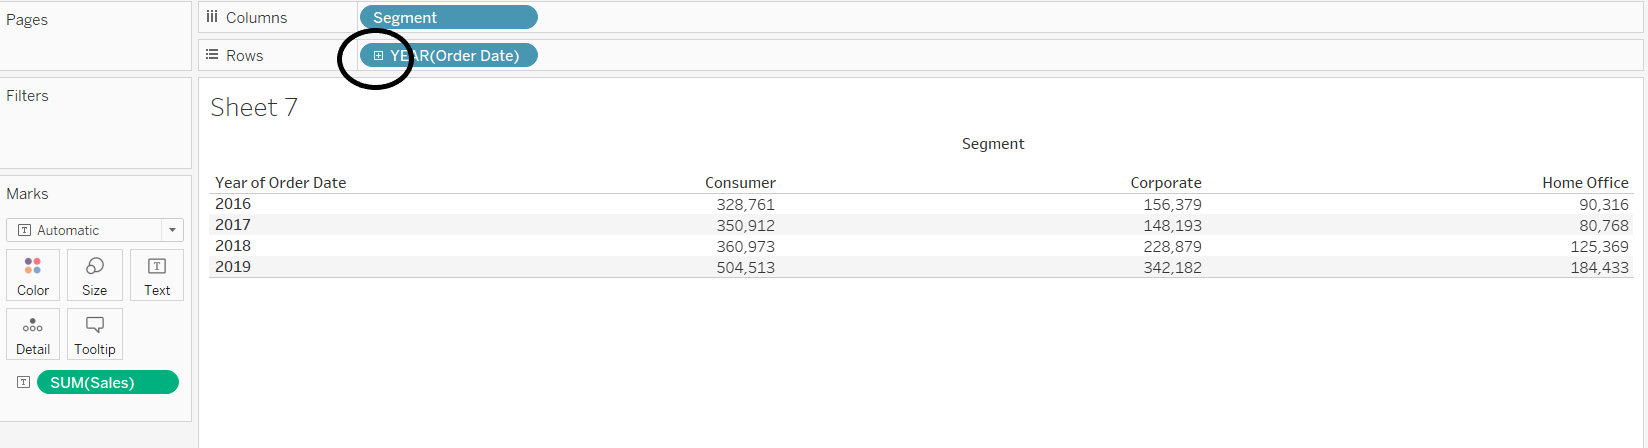
Drill down the order date to quarters by clicking on the + icon on YEAR(Order Date. This will produce the output shown below.
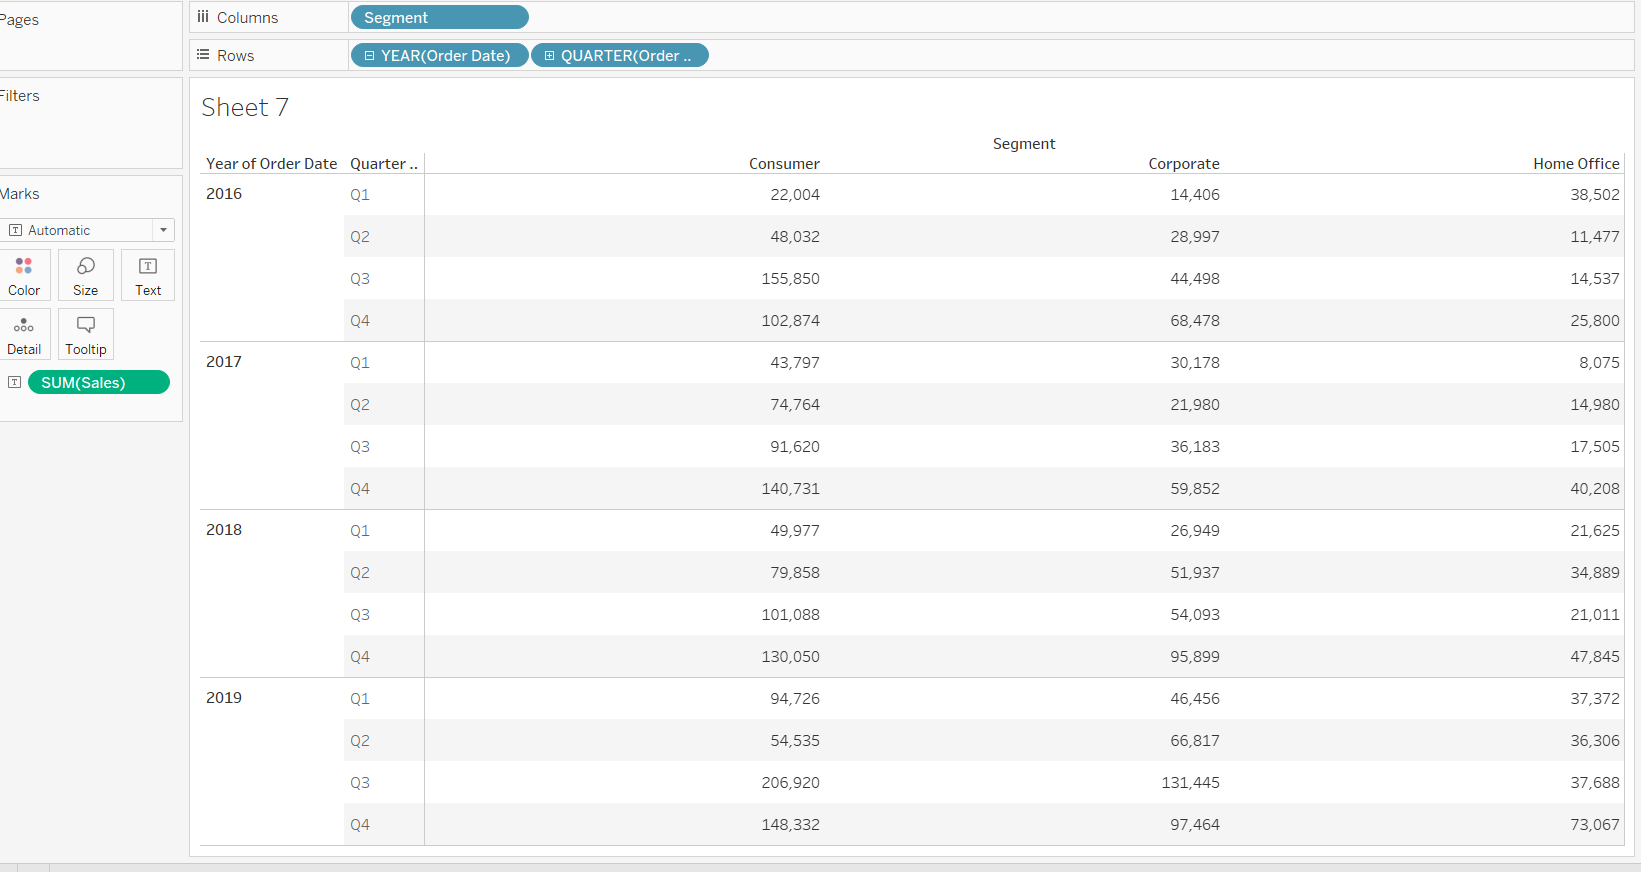
The next step is to right click on the Sales variable and select the Quick Table Calculation option, followed by Percent of Total.
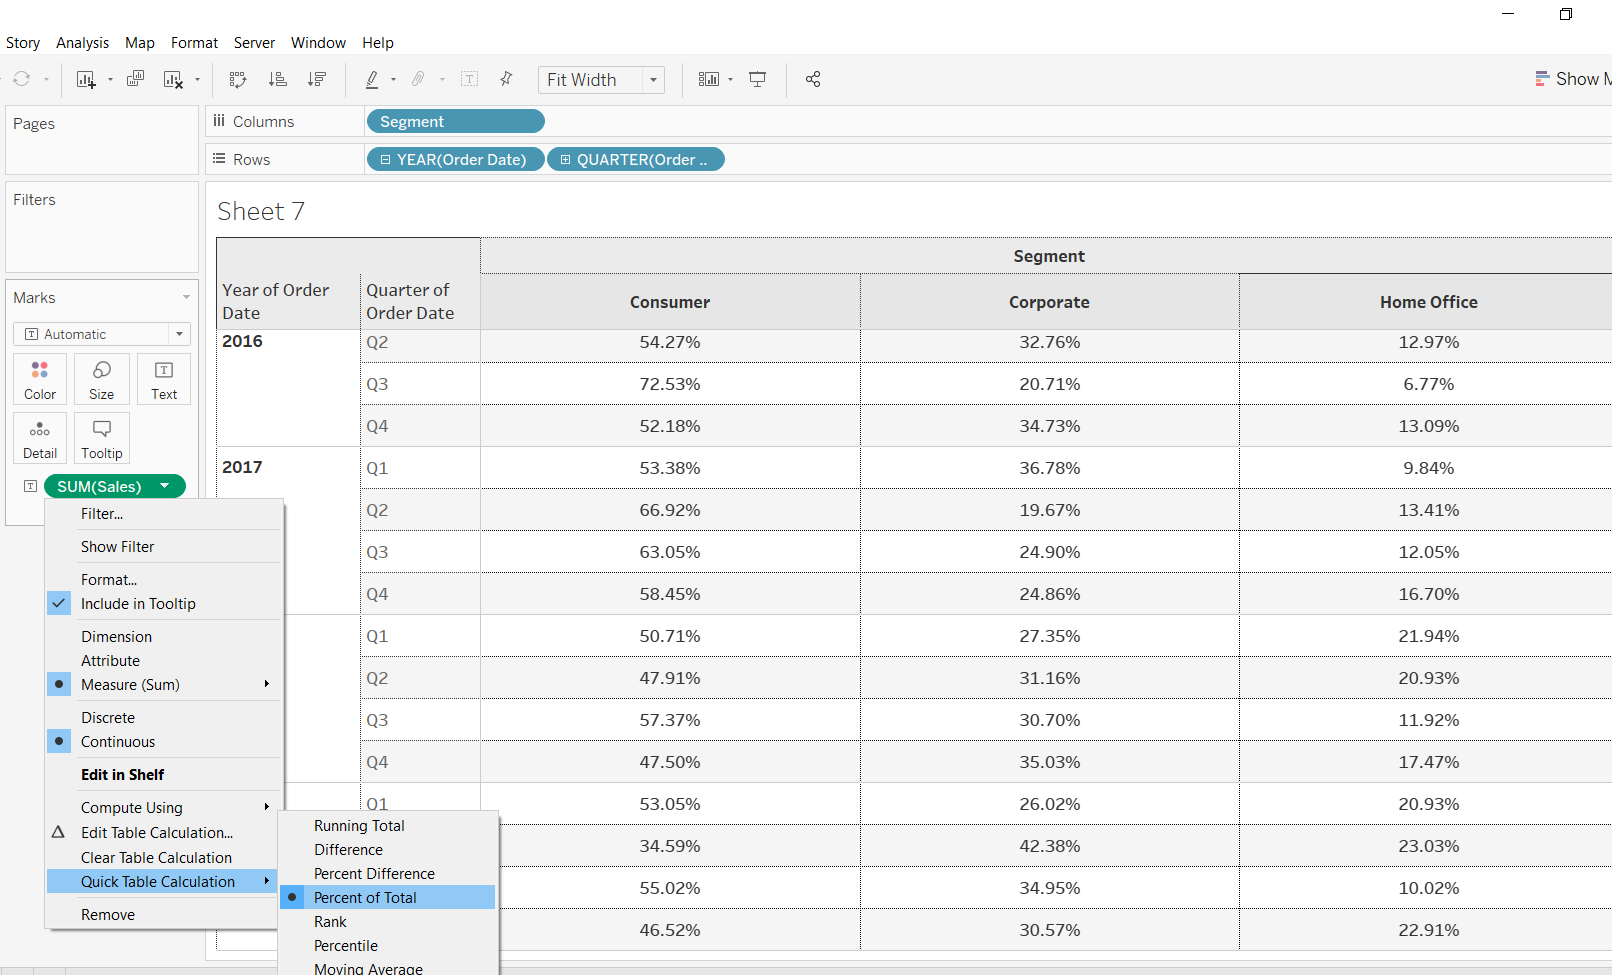
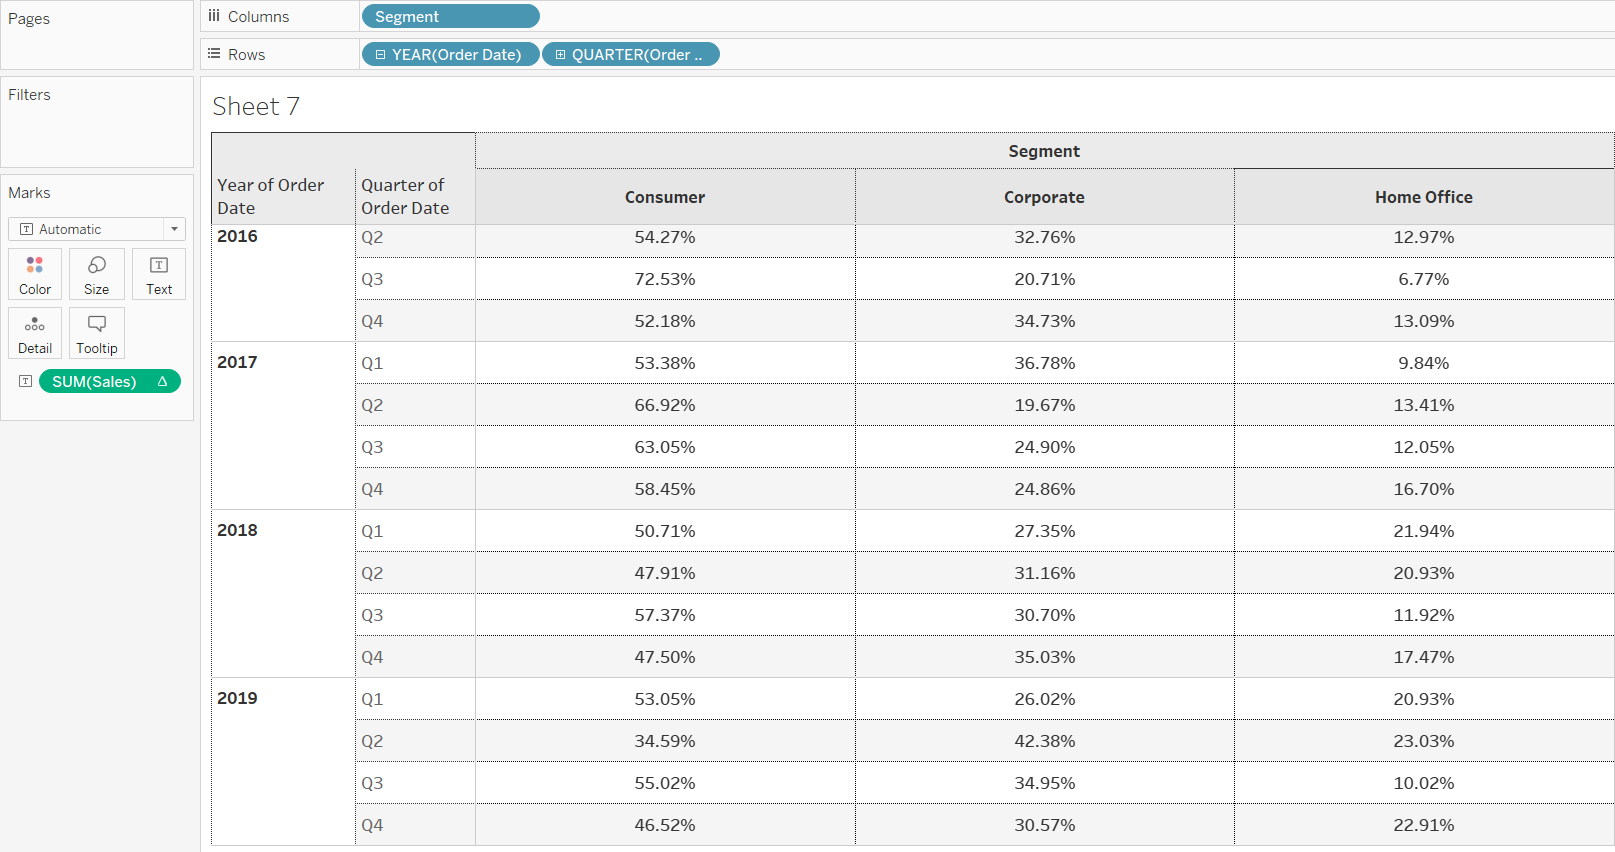
Completing the above steps will produce the following output.
To understand this better, add totals and subtotals into the chart. To do this, go to the Analysis tab and select Totals, followed by Add All Subtotals.
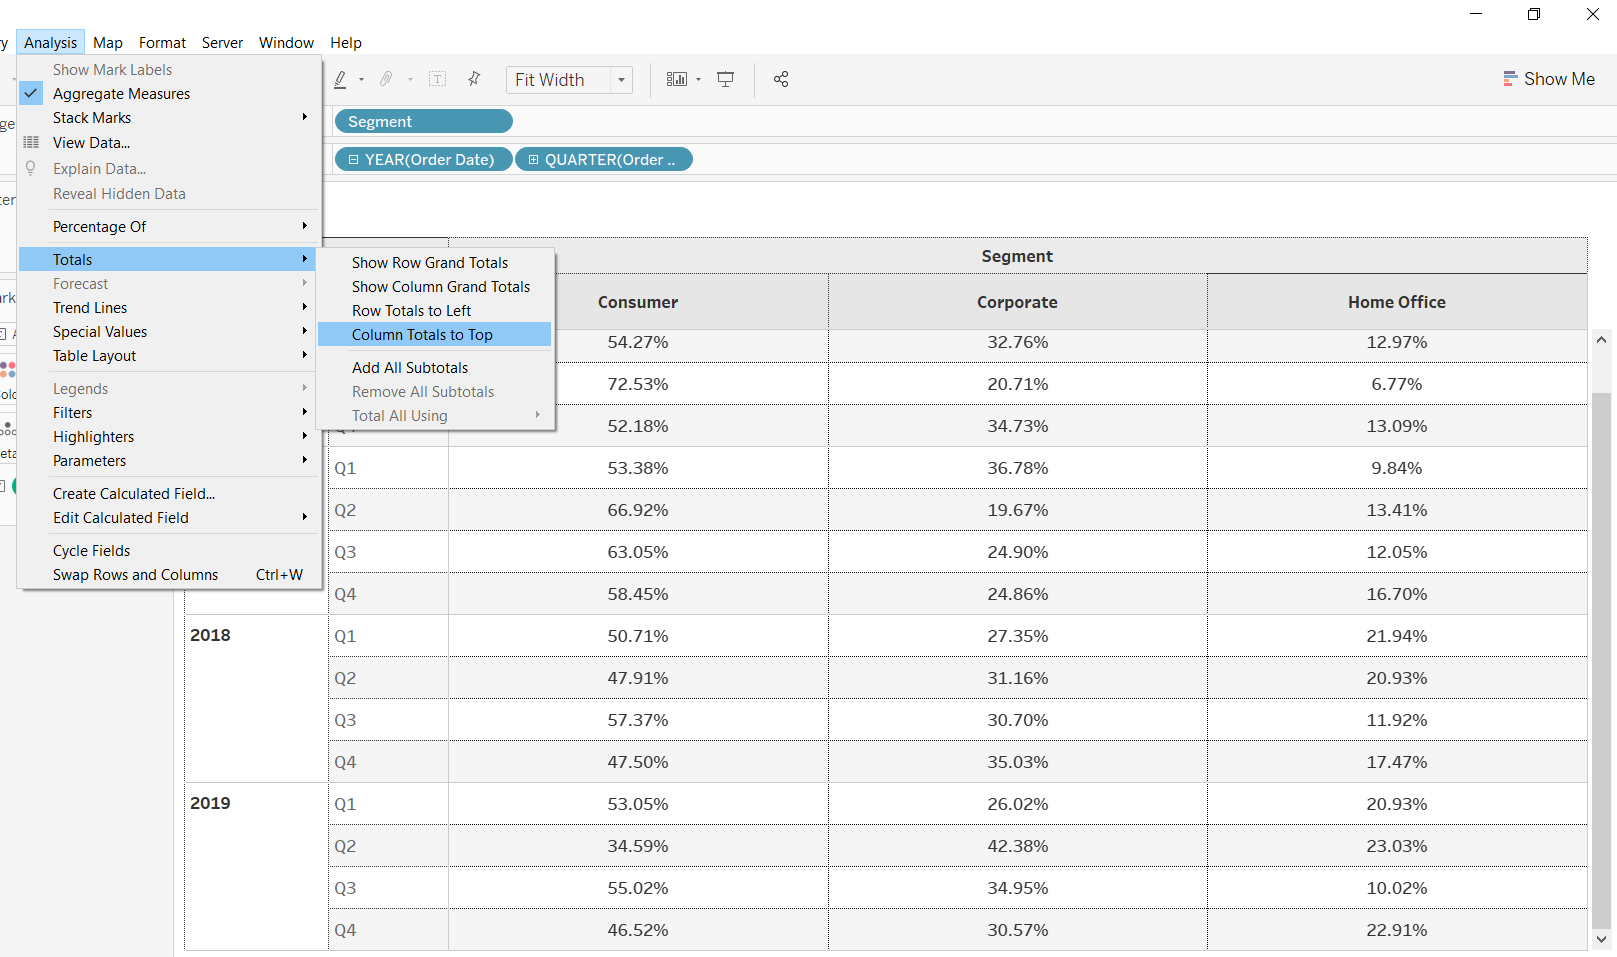
Completing the steps above will generate the following output.
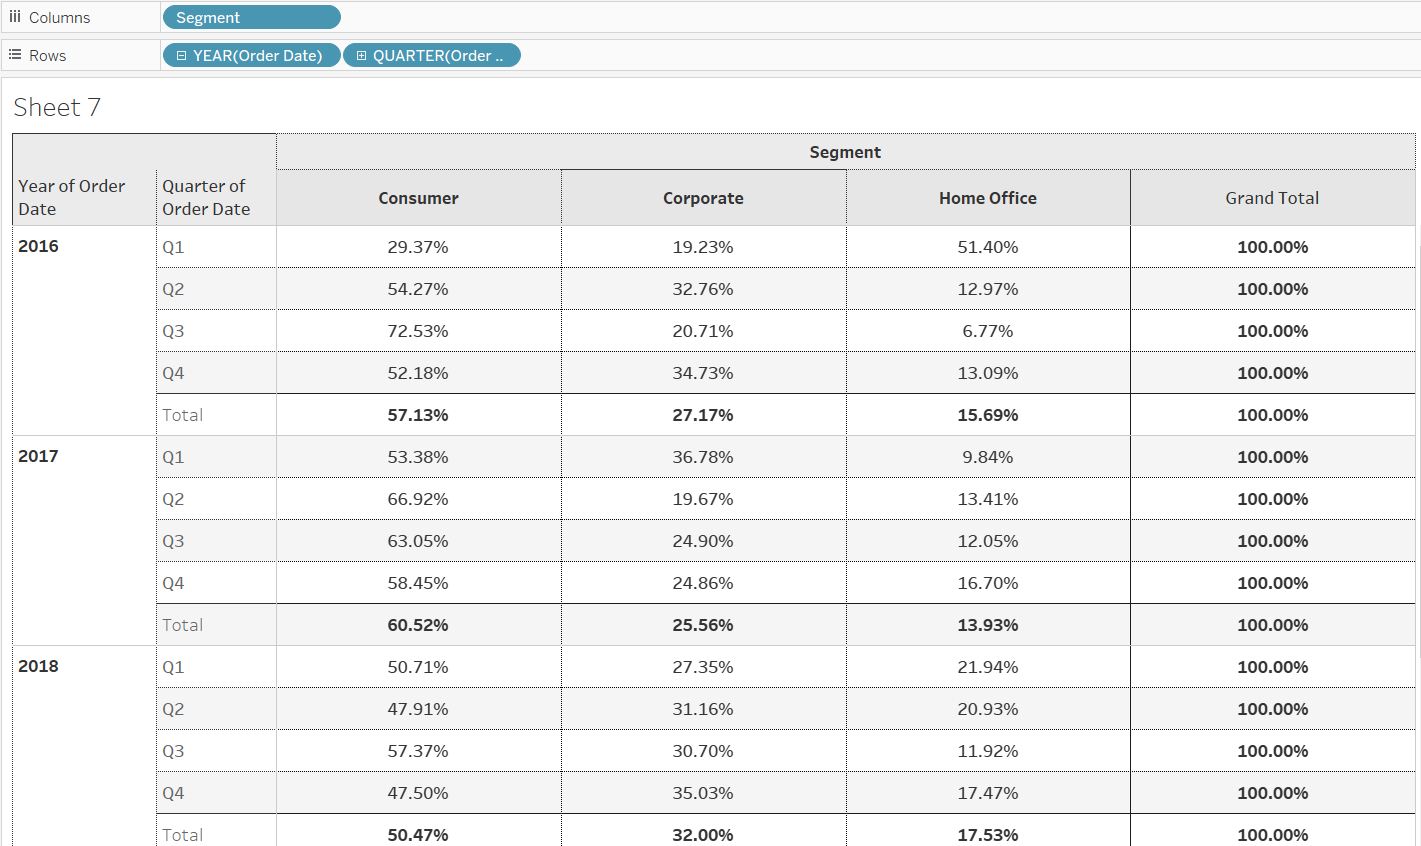
The output above shows that the percent of total calculation is done across the different segments for each quarter of the given year. For example, in the first quarter of year 2016, the consumer, corporate, and home office segments contributed 29.37%, 19.23%, and 51.40% of sales, respectively. The insight is that the home office sales contribution is much higher than the other two segments in this quarter.
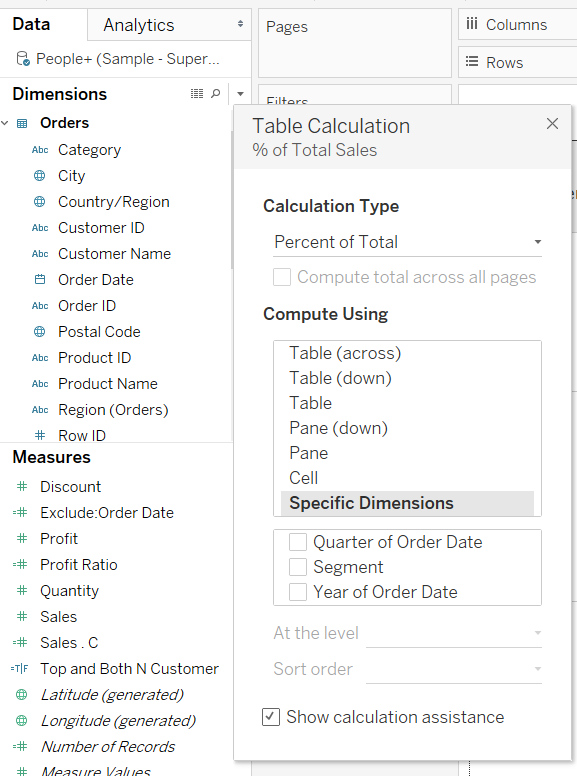
In the output above, you can see that the percent of total is calculated across the segments. It is also possible to visualize the quarterly data across columns. To do this, click on the Sales variable, which is placed into the Text option of the Marks pane, and select the option Compute Using. This is shown below.
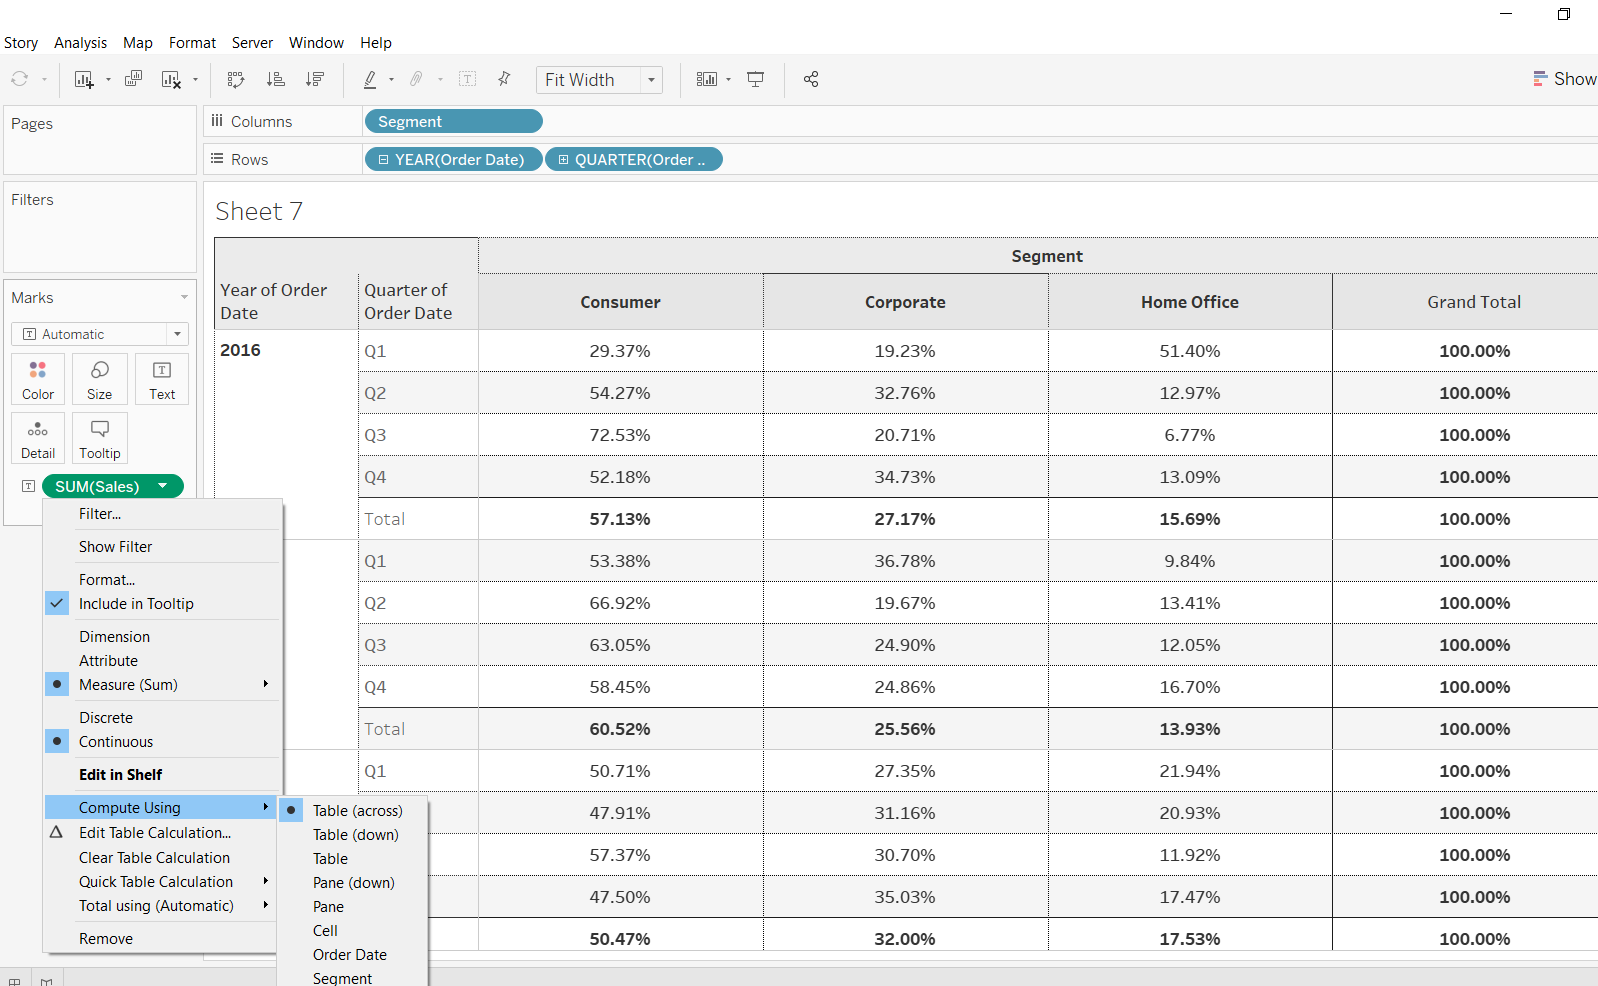
You can see that there are multiple options available, and the default is set to Table (across). You can click on the Edit Table Calculation option to select a computing option and add secondary table calculations.
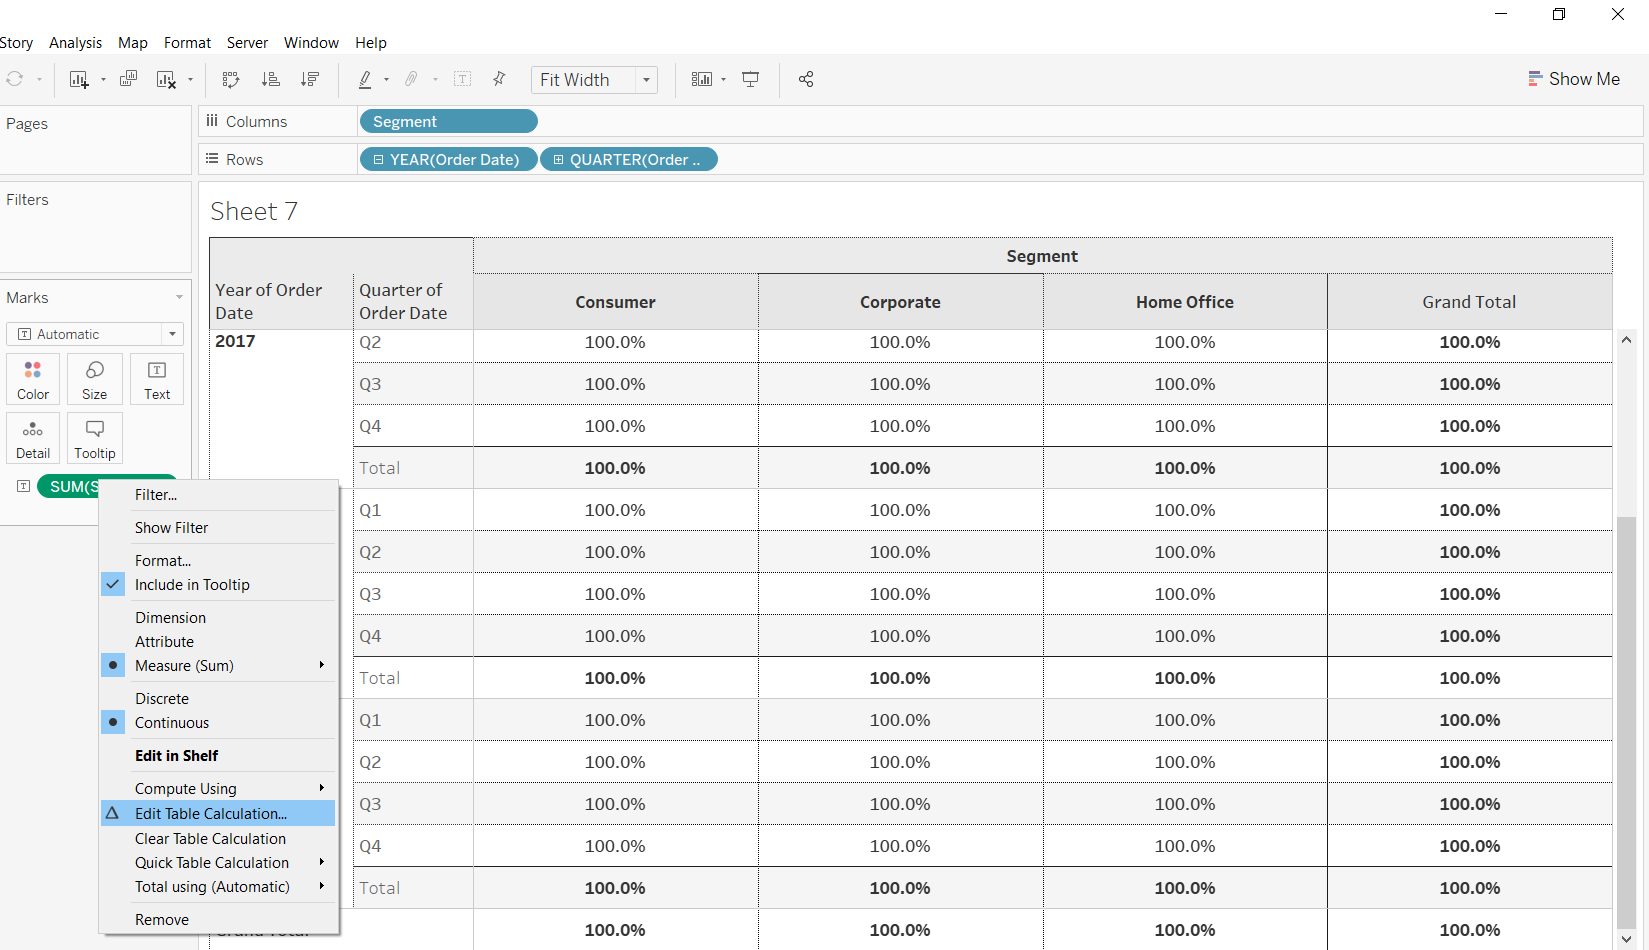
Performing the steps discussed above will open a tab with multiple options, as shown below.
The sections below explain a couple of these options in more detail. To begin, drag the Sales measure again into the Text option of the Marks shelf. You can see that there are two sales measures. The one with the delta sign indicates a table calculation, while the other one is the actual measure.
Selecting the Table (Down) option explained above, the following output is created.
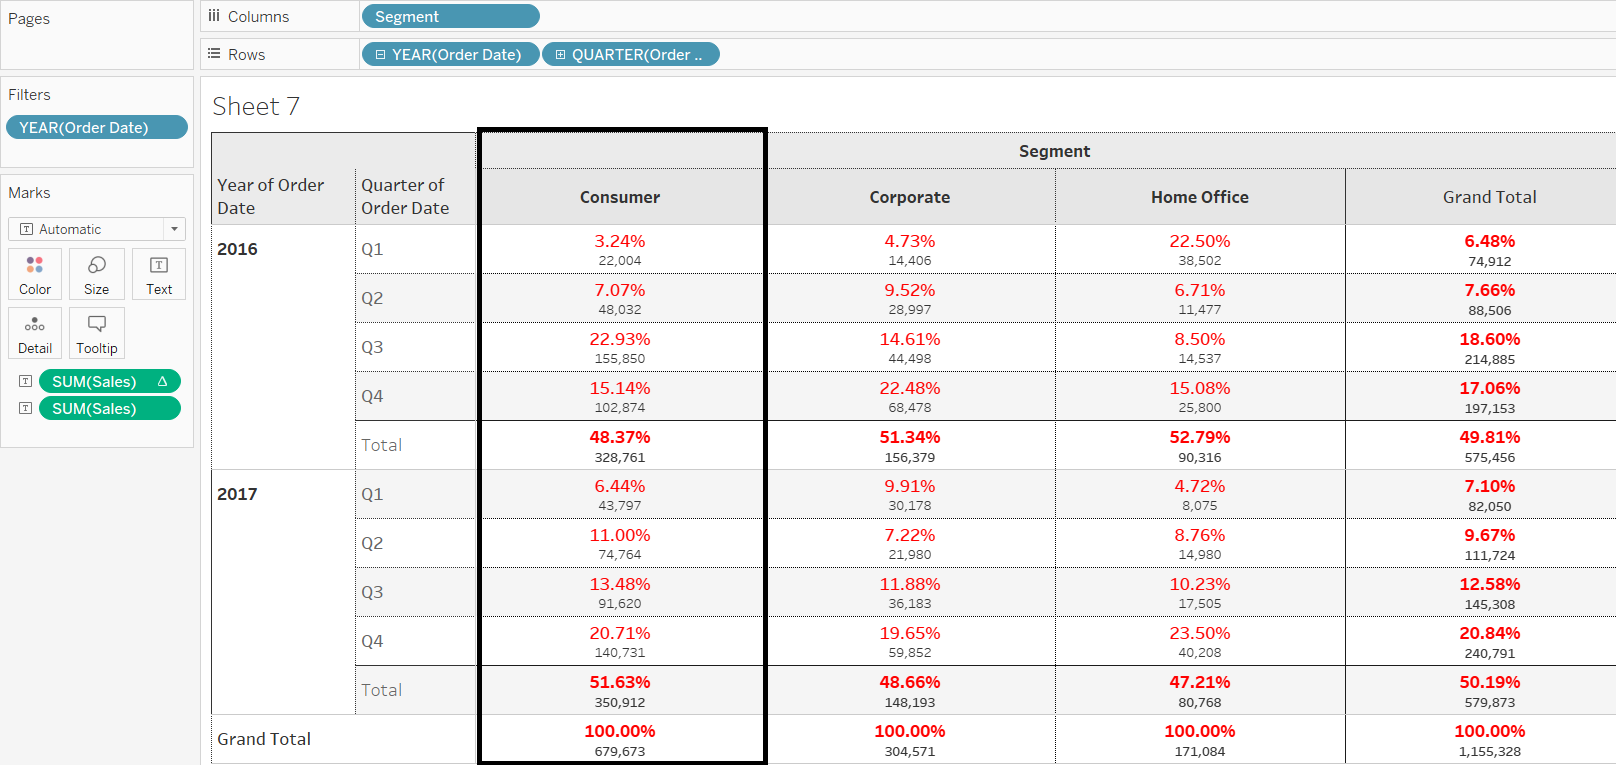
The output above shows that each cell of a column is divided by the total of that column to arrive at the cell percentages. For instance, the first-quarter sales in the year 2016 are 22,004, which is divided by the total of the consumer segment, which is 679,673. This gives the result of 3.24% for this cell.
In the example above, you selected the Table (Down) option. If you select the Pane option, the following output will be created.
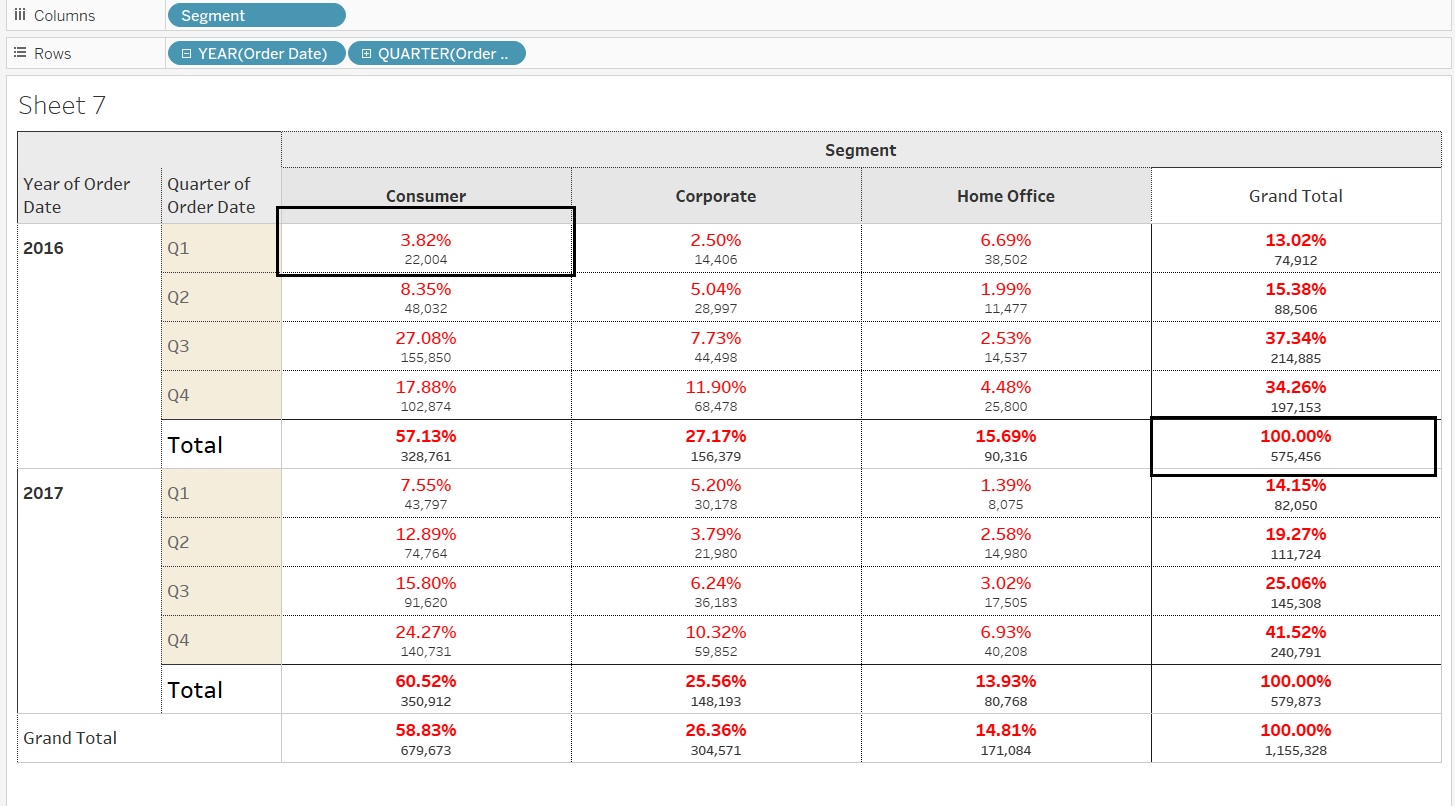
The pane option considers all the cells individually and divides them by the total pane value. For instance, the first-quarter sales in the year 2016 are 22,004, which is divided by the total pane value of 575,456. This gives the result of 3.82% for this cell.
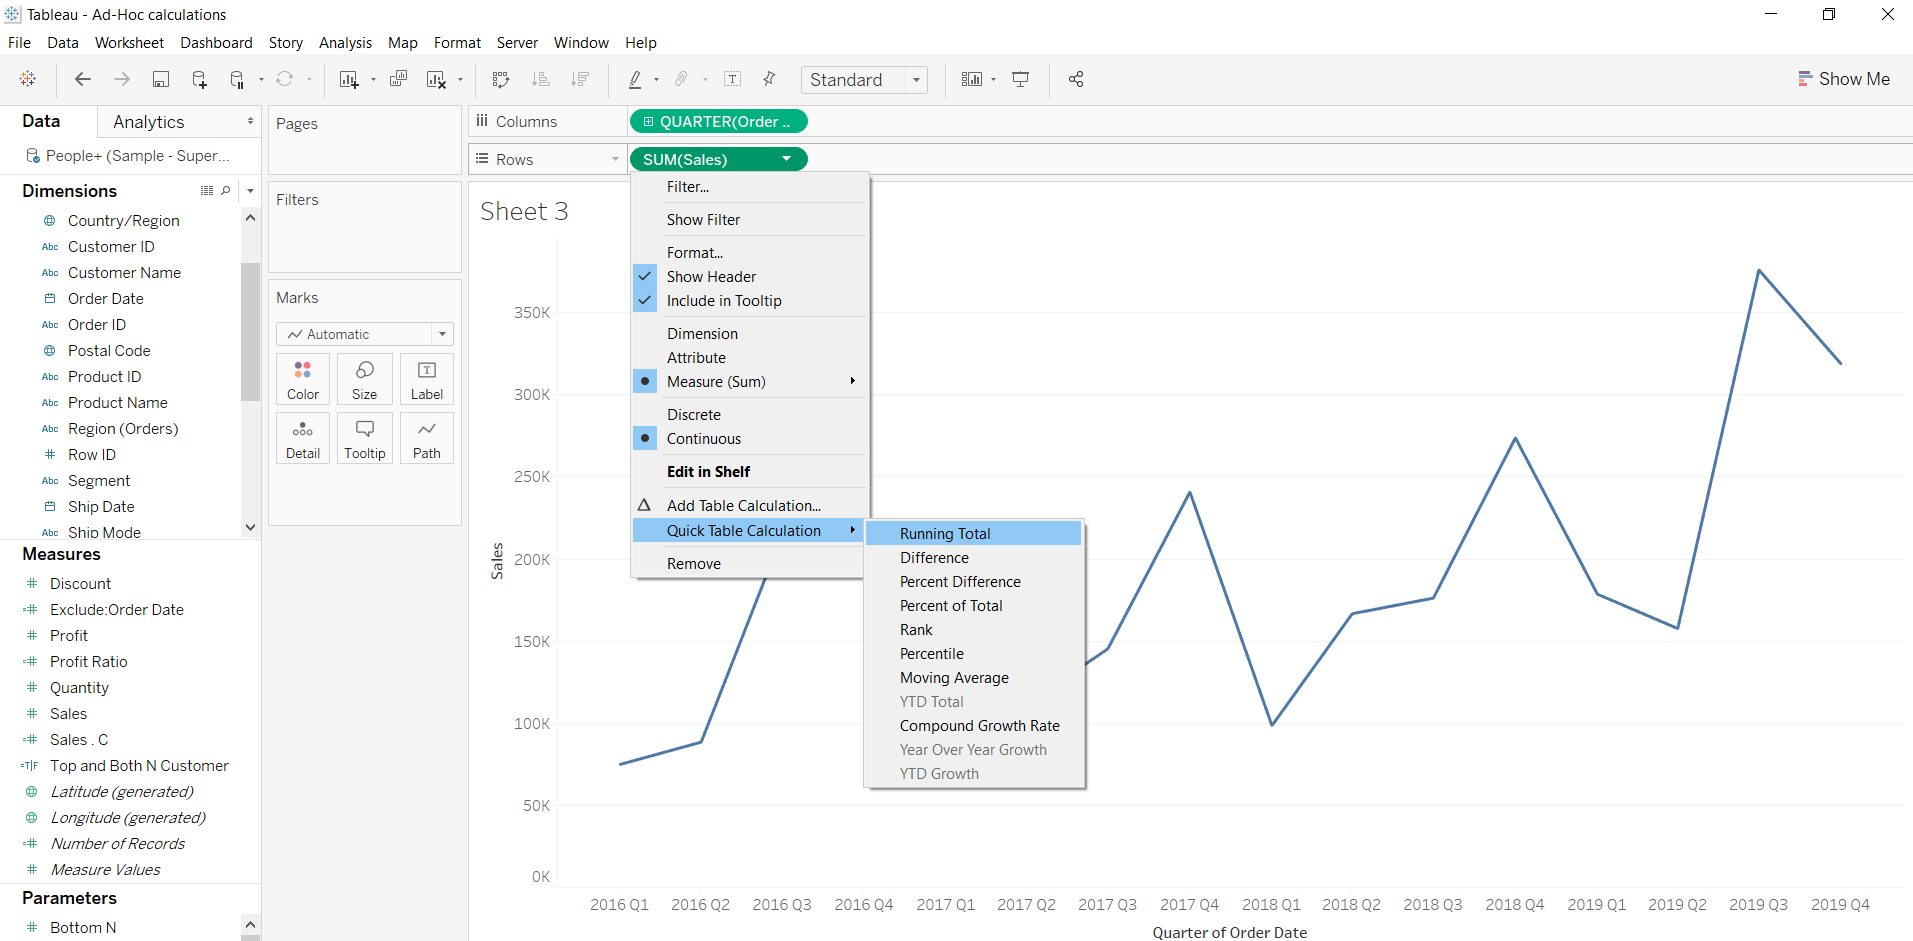
To calculate other quick table calculations, such as running total, go to Quick Table Calculation and select Running Total. The first step for performing this calculation is to drag Order Date into the Columns shelf and make it continuous. Next, drag the Sales measure into the Rows shelf and select Running total from the quick table calculation.
Next, drag actual sales and sales table calculated above to the Marks shelf in the text. Filter the years to select 2016 and 2017. Finally, select Bar from the Marks shelf.
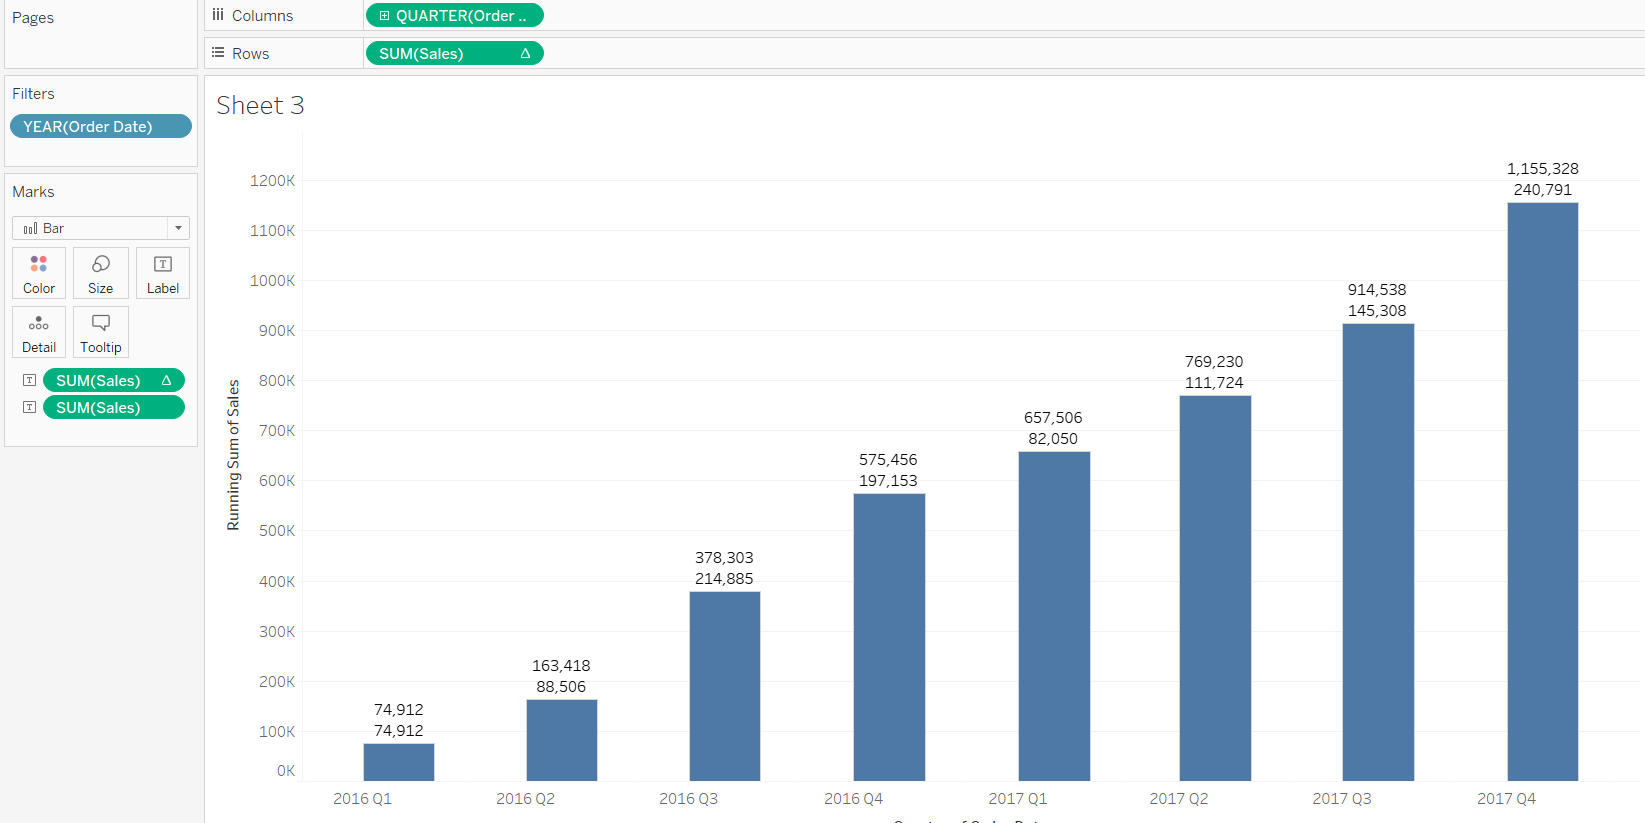
In the output above, the first number indicates the sales in that quarter, while the second number indicates the running total. This way it is easy to visualize actual and running totals for the quarter.
Conclusion
In this guide, you learned how to create quick table calculations in Tableau and applied this knowledge with various examples. This skill will strengthen your business analytics and visualization capabilities.
To learn more about visualization and data analysis using Tableau, please refer to the following guides:
- Building Dual-Axis Combination Charts in Tableau
- Building a Box-and-Whisker Plot in Tableau
- Building a Time Series Chart in Tableau
- Building a Gantt Chart in Tableau
- Building a Bullet Graph in Tableau
- Use Built-In Statistical Modeling in Tableau
- Building a Burndown Chart in Tableau
- Adding Trend Lines to Continuous Charts in Tableau
- Create a Reference Band in Tableau
- Create a Reference Line in Tableau
- Describe and Identify Fixed Level of Details Calculations in Tableau
- Describe and Identify Include Level of Detail Calculations in Tableau
- Describe and Identify Exclude Level of Details Calculations in Tableau
- Create Type-in/Ad-hoc Calculations in Tableau
Advance your tech skills today
Access courses on AI, cloud, data, security, and more—all led by industry experts.
