Descriptive Statistics with Azure Machine Learning Studio
In this guide, you will work with the Adult Census Income Binary Classification dataset to generate descriptive statistics using Azure Machine Learning Studio.
Oct 19, 2020 • 11 Minute Read
Introduction
Descriptive statistics is a field in statistics that describes data. It's useful in data understanding and exploration, an extremely important task in machine learning. It's also used to identify data errors and anomalies, an important data modelling task in machine learning. In this guide, you will learn how to generate descriptive statistics for the variables in data using Azure Machine Learning Studio.
Data
In this guide, you will work with the Adult Census Income Binary Classification dataset available in Azure Machine Learning Studio. This is a subset of the 1994 census database using working adults over the age of 16 with an adjusted income index of greater than 100. The data is used as a classification machine learning problem where the objective is to classify people using demographics to predict whether a person earns over US$50,000 a year. The data comes from the UCI Machine Learning Repository.
Loading the Data
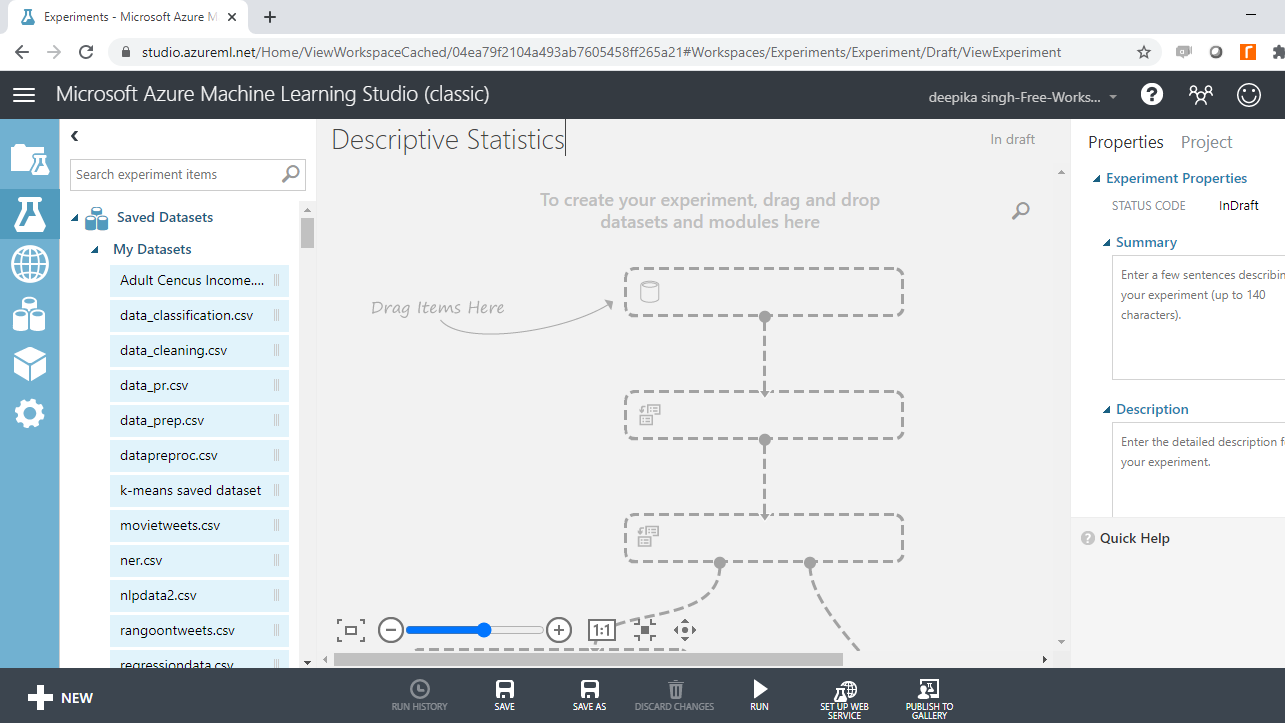
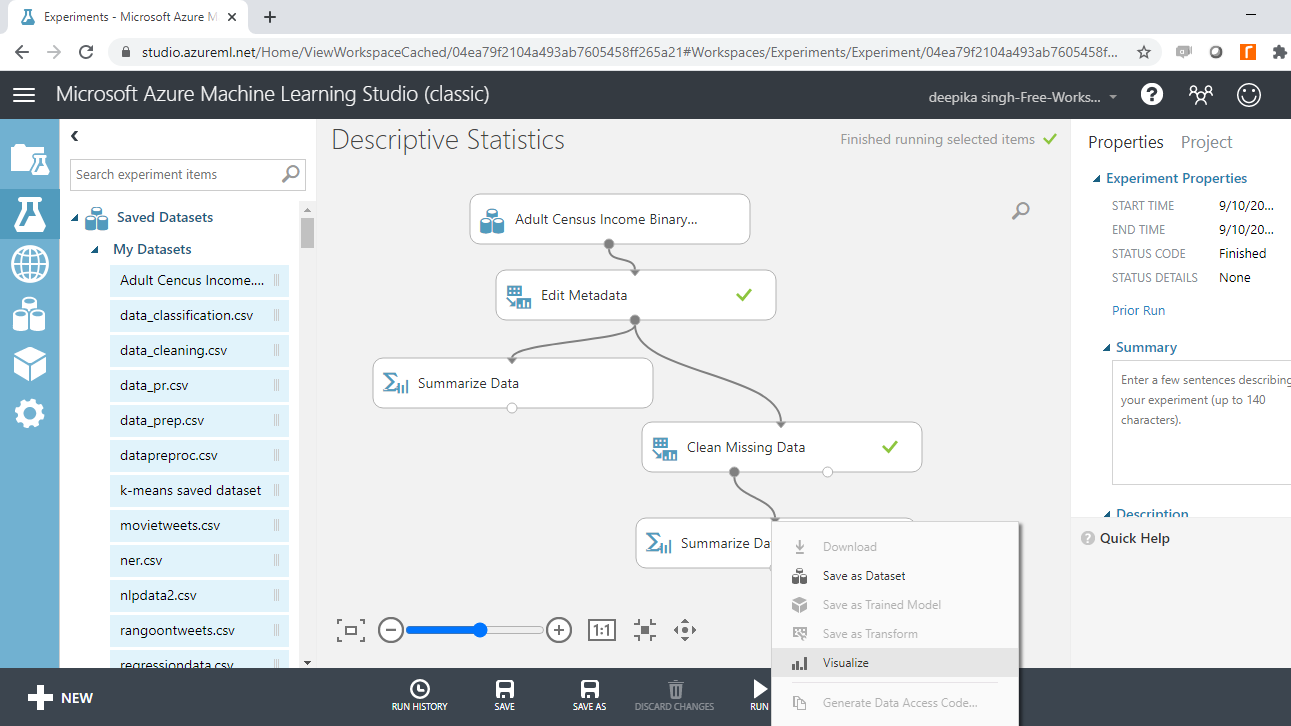
Once you have logged into your Azure Machine Learning Studio account, click on the EXPERIMENTS option, listed on the left sidebar, followed by the NEW button. Next, click on the blank experiment and give the name Descriptive Statistics to the workspace. The following screen will be displayed.
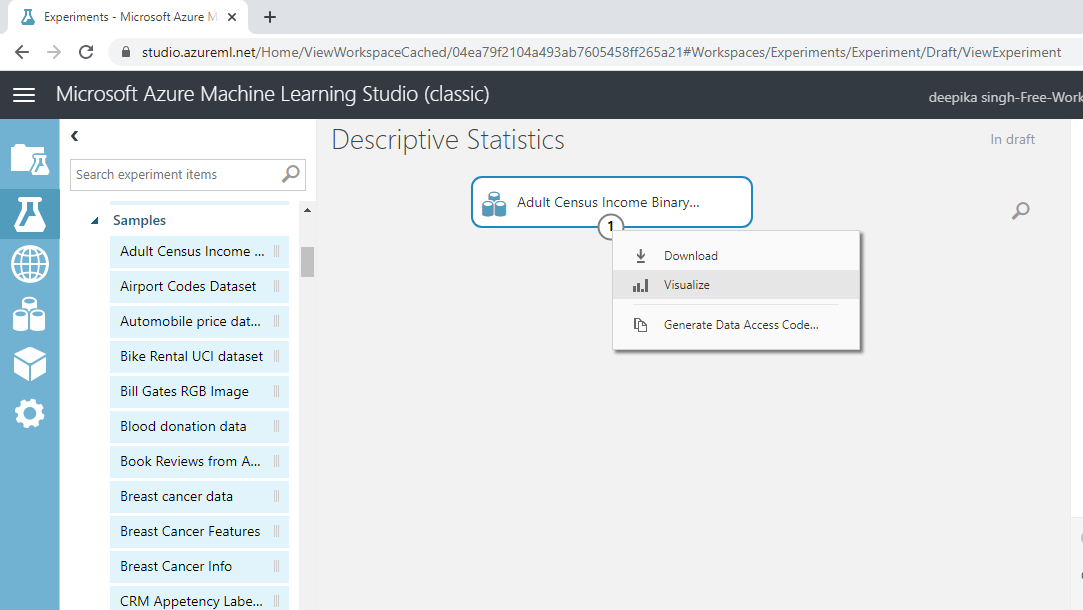
Under the Saved Datasets option, drag Adult census Income Binary dataset into the workspace. Right-click and select the Visualize option to explore the data.
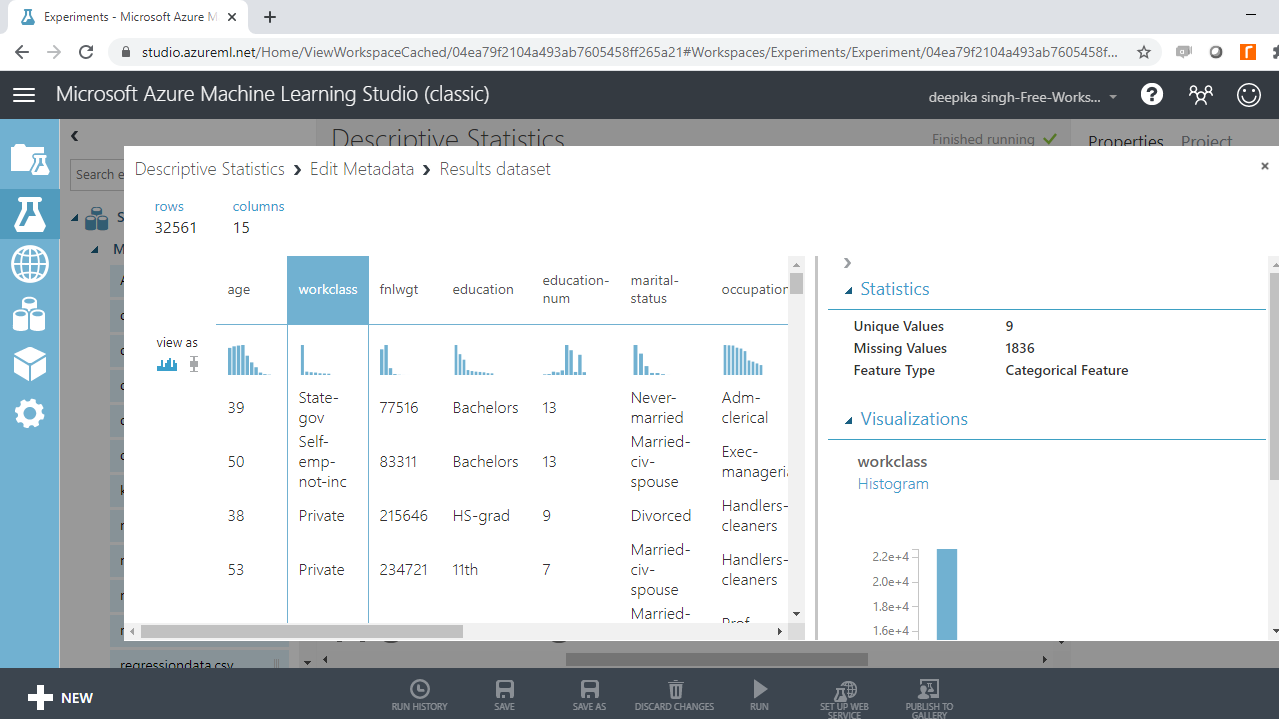
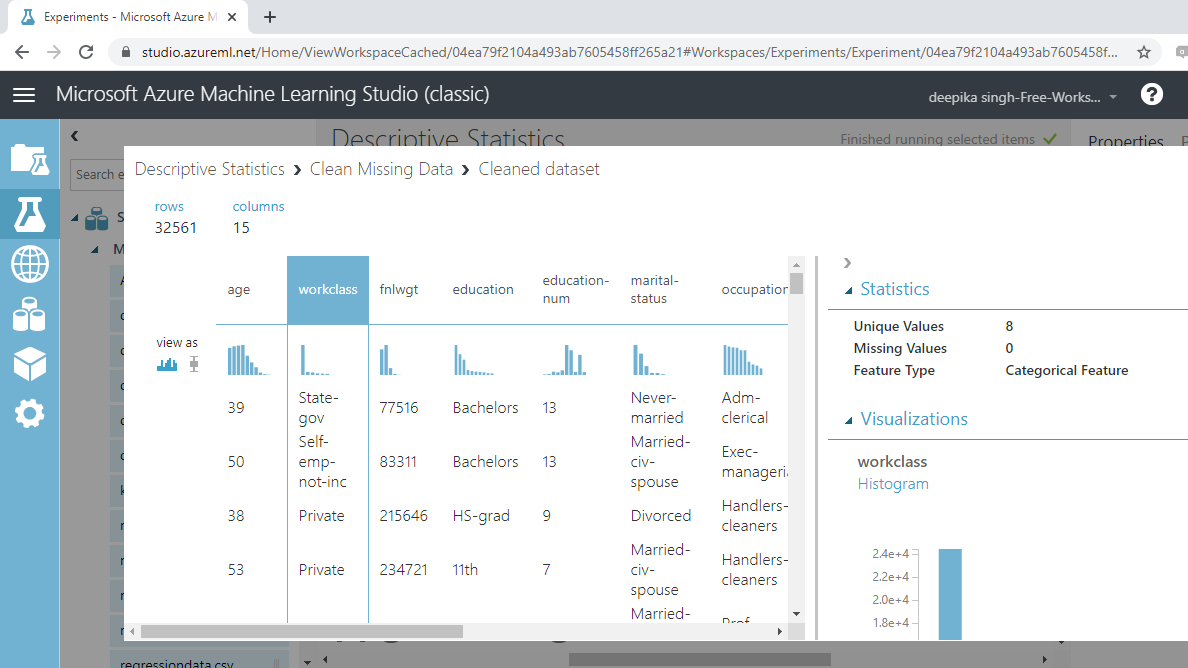
The data contains 32561 rows and 15 columns. Selecting any variable will display its Statistics as shown below.
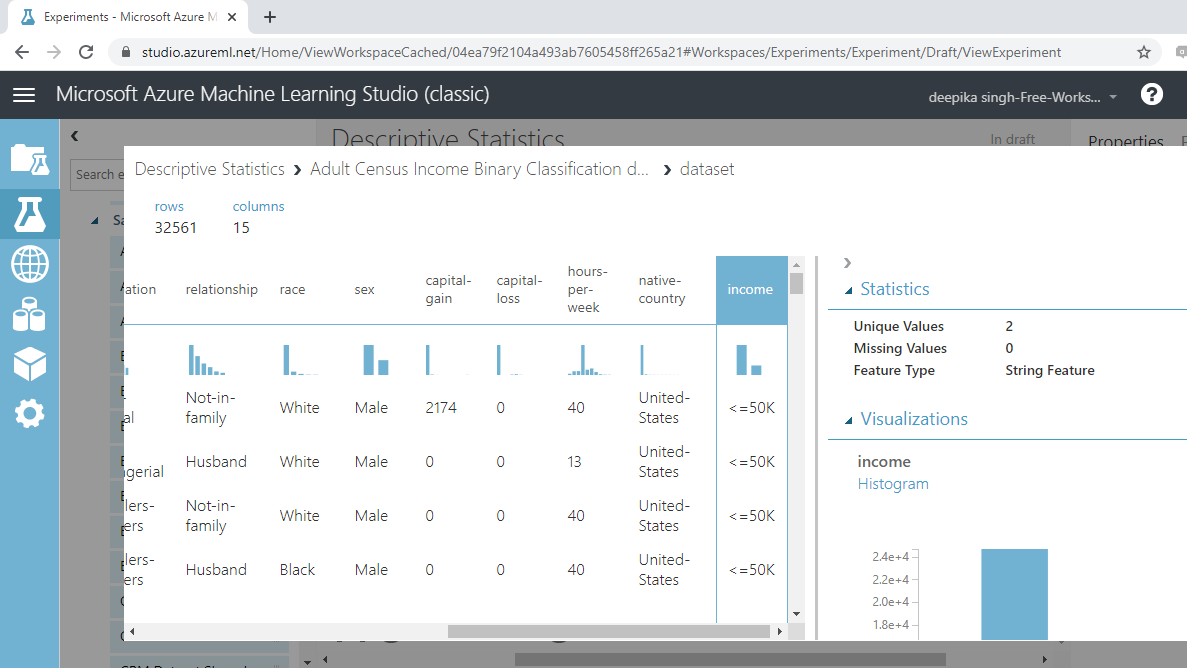
The output above shows that Income is a string feature type. This and similar features will be converted to categorical.
Descriptive Statistics
The most popular measures used in descriptive statistics are highlighted below.
-
Mean: Mean represents the arithmetic average of the data. It is calculated by taking the sum of the values and dividing by the number of observations.
-
Median: The middle-most value of a variable in a data, when arranged in an ascending or descending order, is its median value.
-
Mode: Mode represents the most frequent value of a variable in the data and is the only central tendency measure that can be used with both numeric and categorical variables.
-
IQR: The Interquartile Range (IQR) is calculated as the difference between the third quartile (75th percentile) and the first quartile (25th percentile).
-
Range: The difference between the maximum and minimum values of a variable gives its range.
The following sections outline the implementation in Azure Machine Learning Studio.
Editing Metadata
The first step is to convert the variables to the right data type. Search and drag the Edit Metadata module into the workspace.
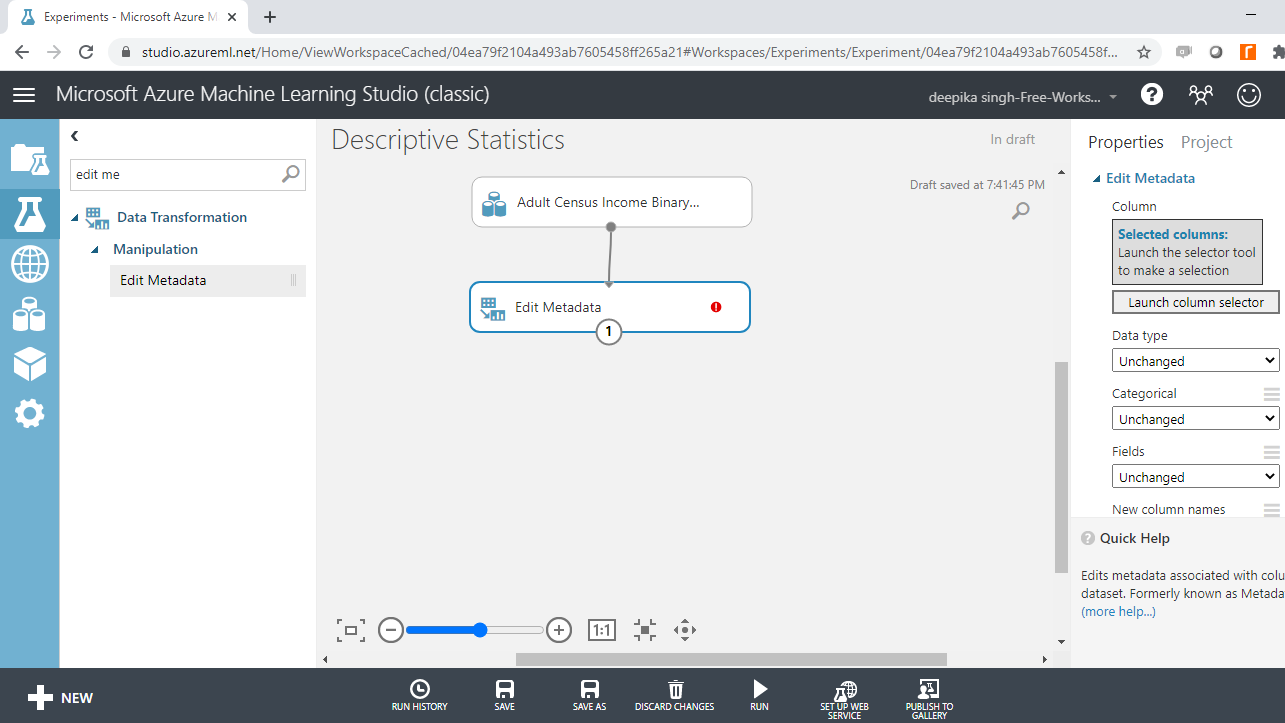
Click on the Launch column selector option in the righthand side of the workspace and select the string variables from the available columns.
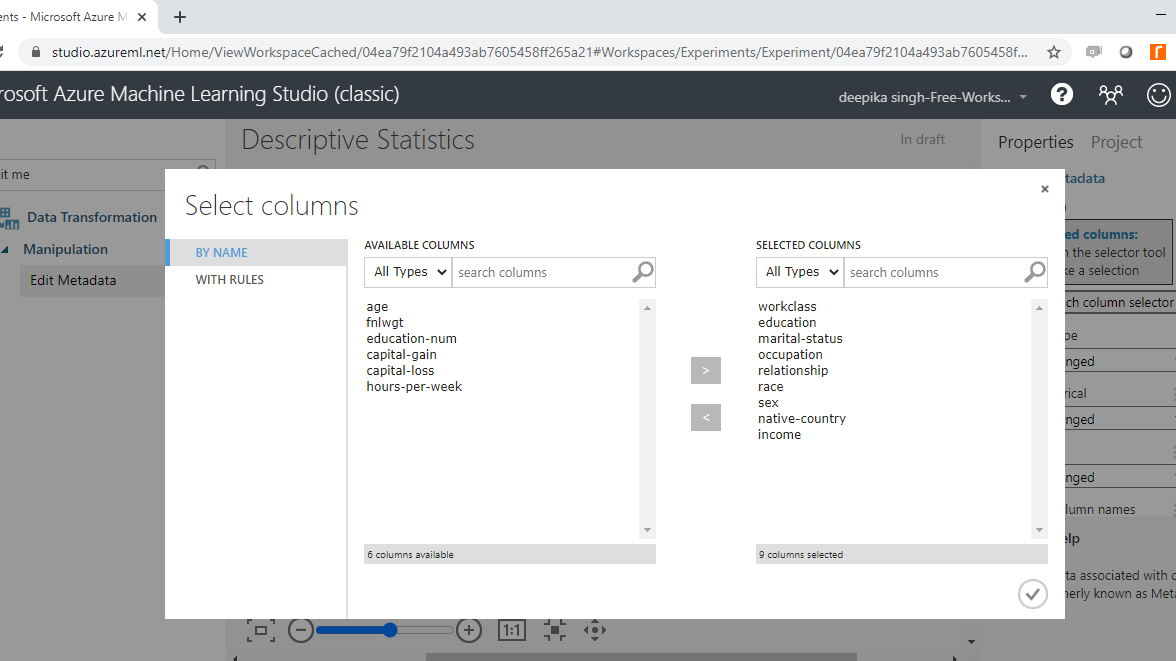
Once you have made selections, the selected columns will be displayed in the workspace. Next, from the dropdown options under Categorical, select the Make categorical option.
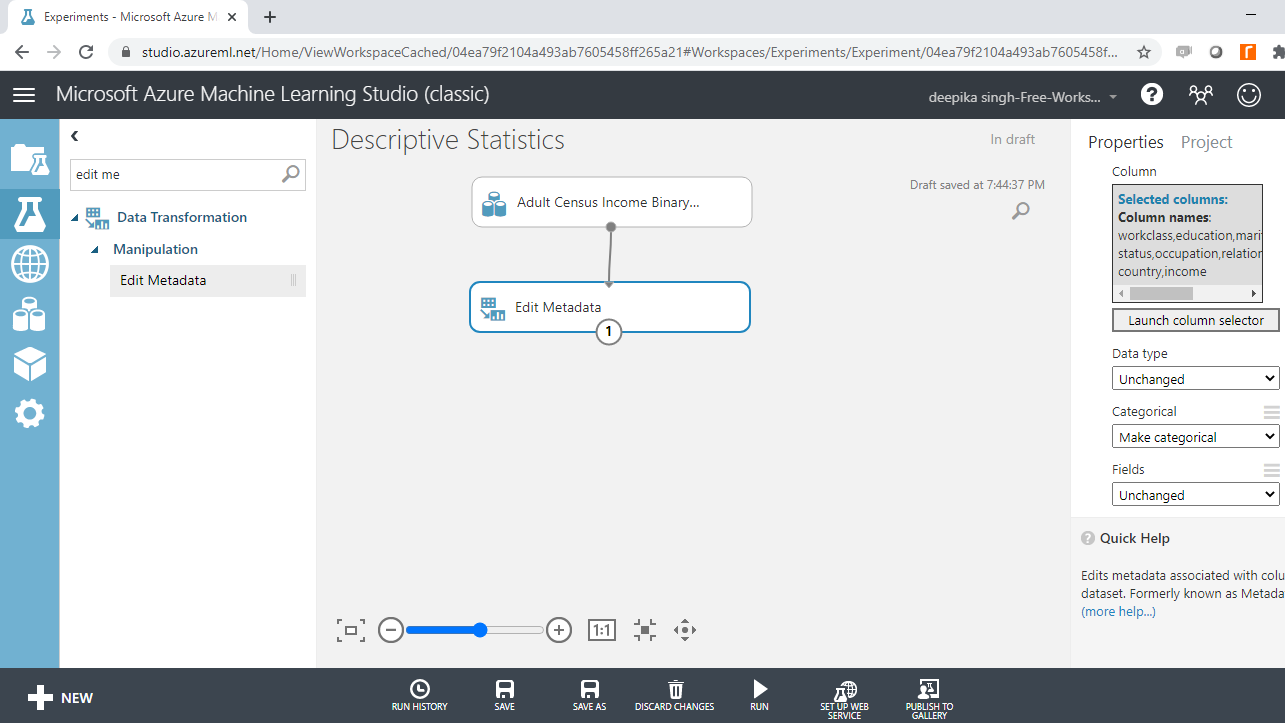
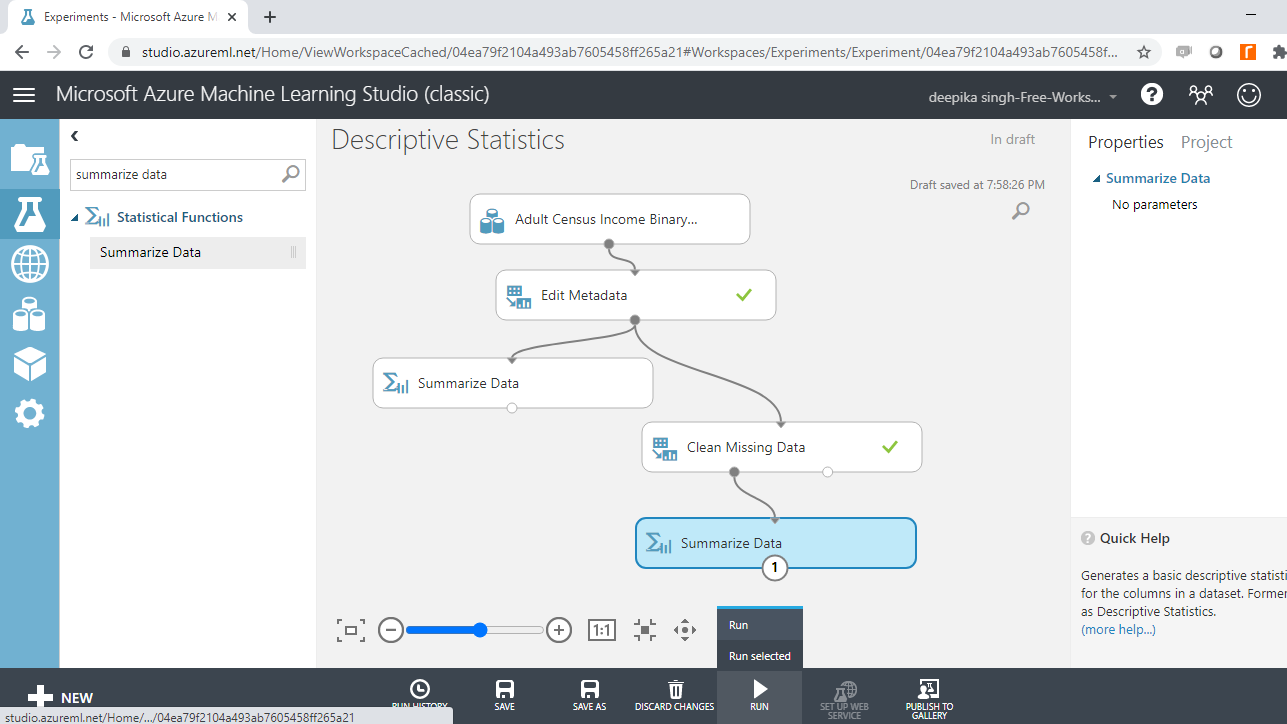
Next, click on the Run button at the bottom of the workspace, and right-click to Visualize the output.
The above output shows that the variable workclass is converted to Categorical Feature.
Summarizing Data
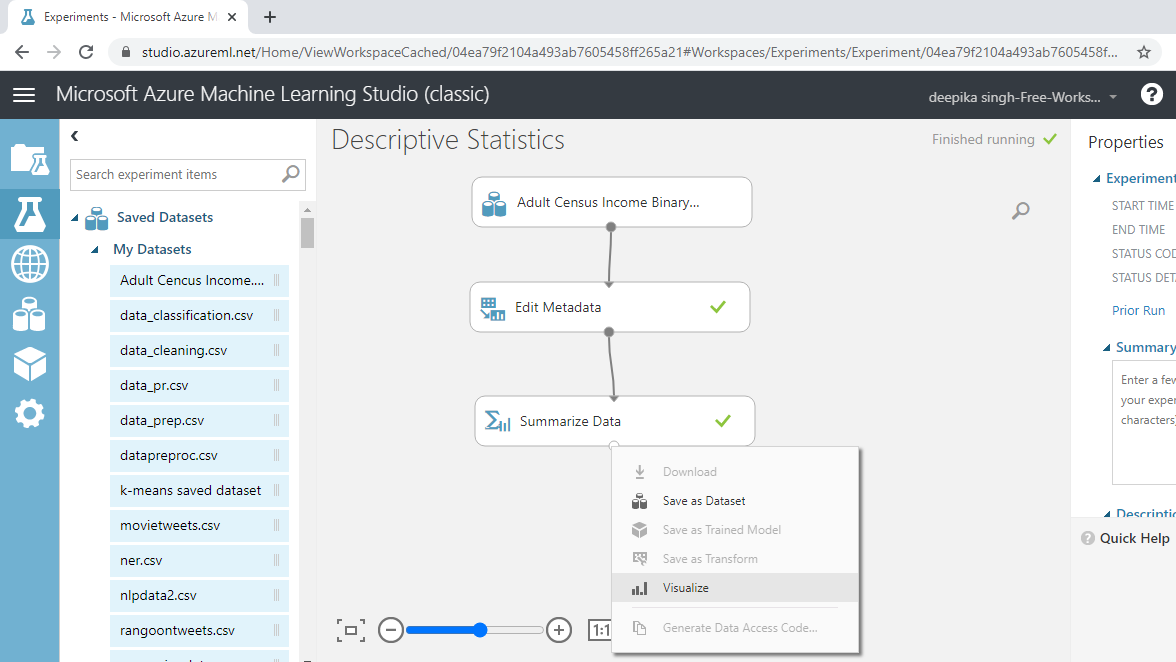
The Summarize Data module is used to generate descriptive statistics for the variables in the dataset. This module is in the Statistical Functions category. Search and drag it in the workspace.
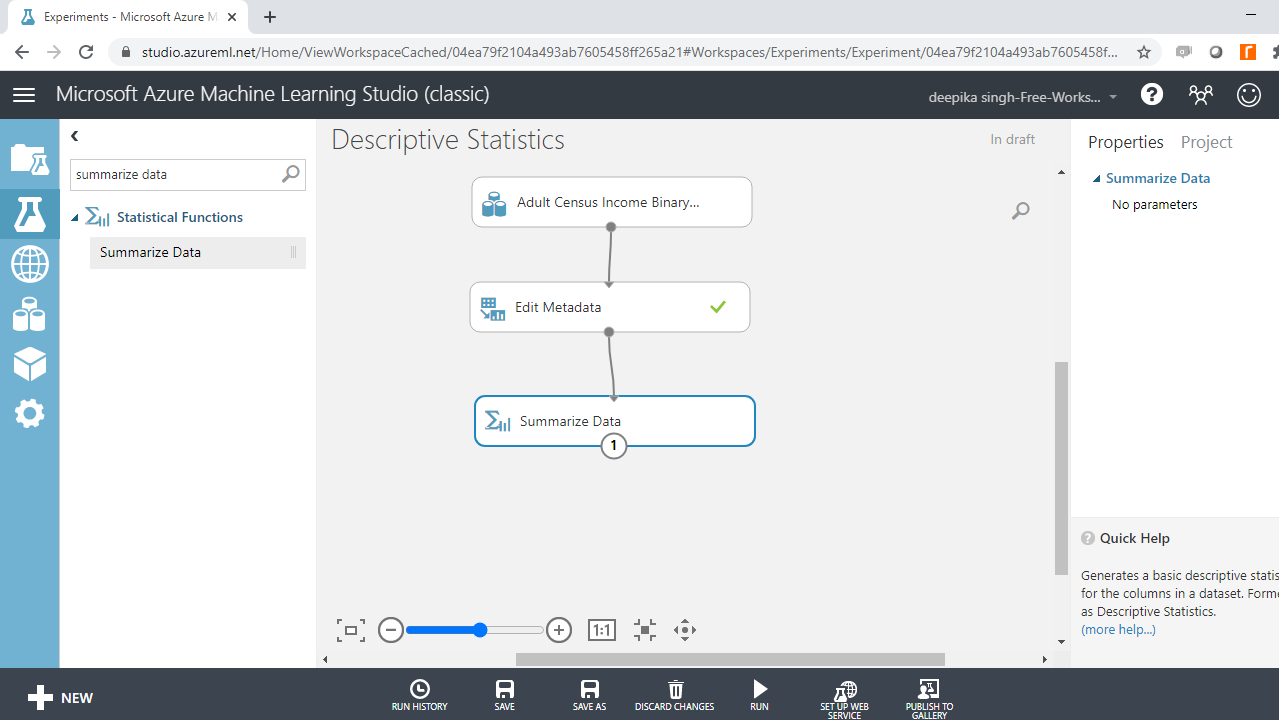
Run the experiment, and right-click to select Visualize to look at the output.
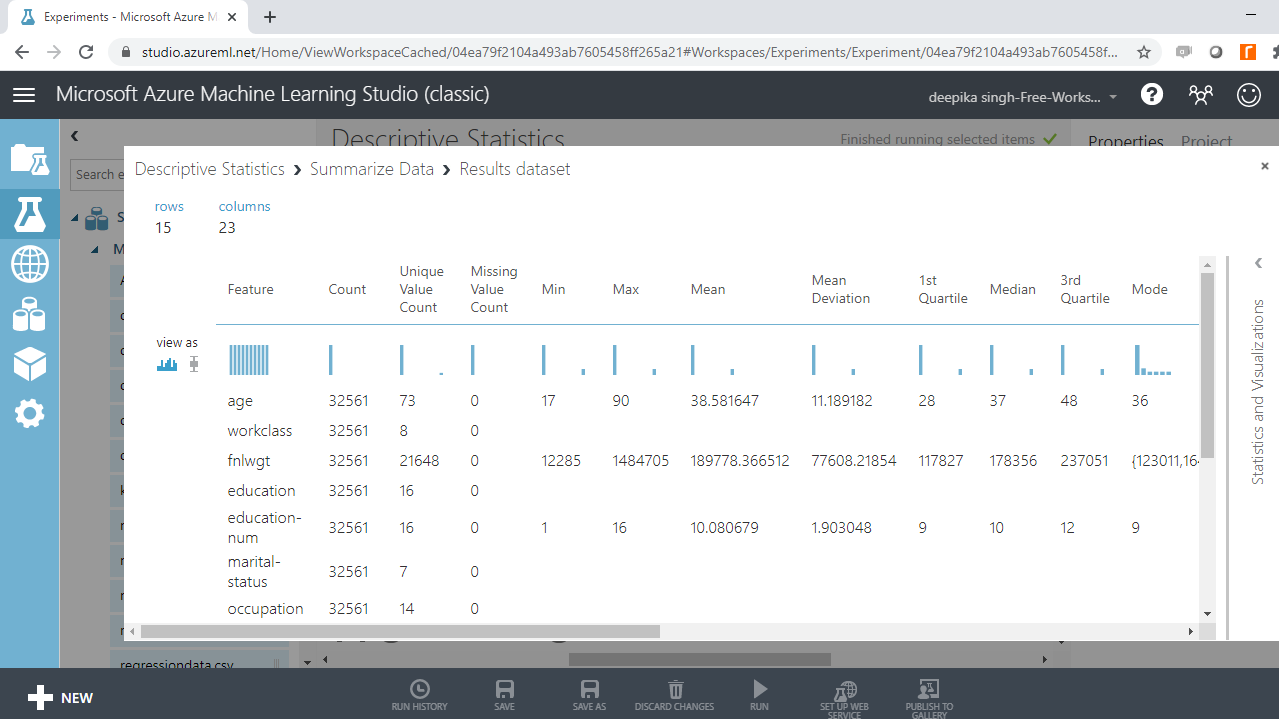
The following output is generated. You can look at the range of statistical measures such as count, missing value count, mean, median, and mode of each variable.

Interpretation of the Output
The variable age has no missing values, and the mean, median, and mode values are 38.6 years, 37 years, and 36 years, respectively. The minimum age value is 17 years, while the maximum age is 90 years. This means the range of the age variable is 73 years. The interquartile range can be calculated by computing the difference between the first quartile (28 years) and third quartile (48 years). This gives the IQR value of 20 years.
In the same manner, the descriptive statistics of numerical variables can be computed. The above output also shows the presence of missing values. It is advisable to clean missing values and look again at the summary statistics.
Missing Value Treatment
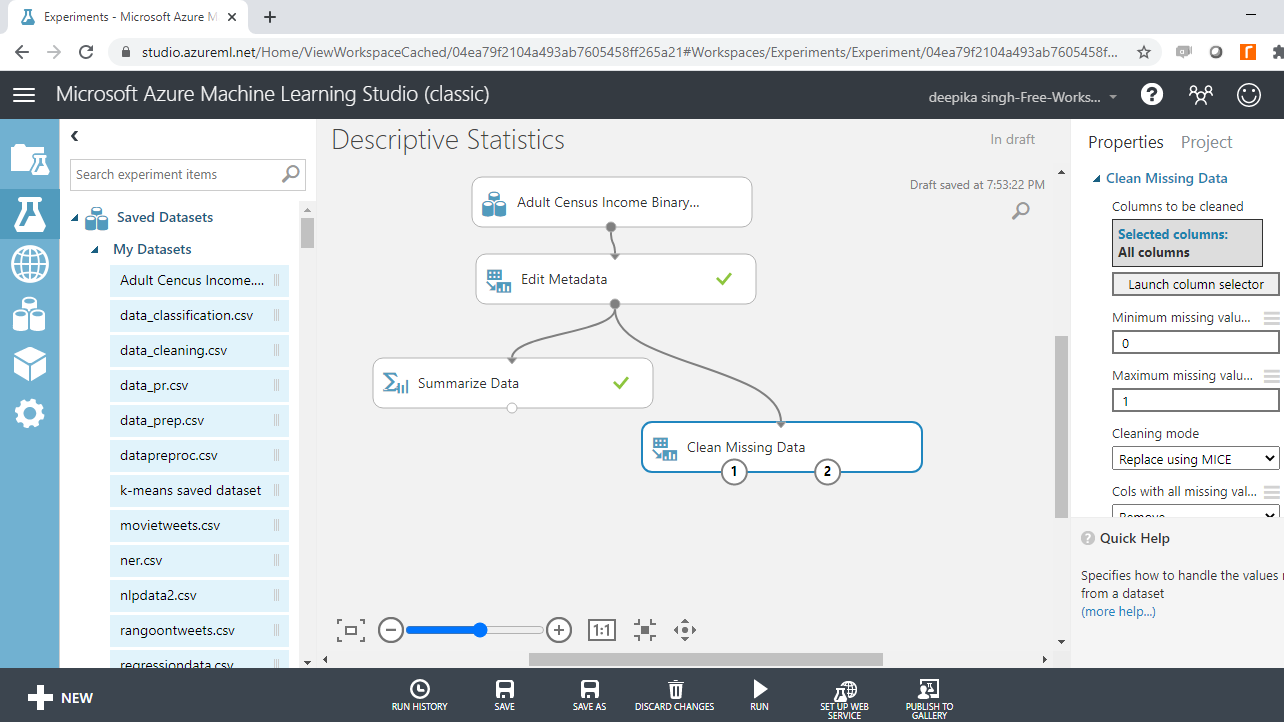
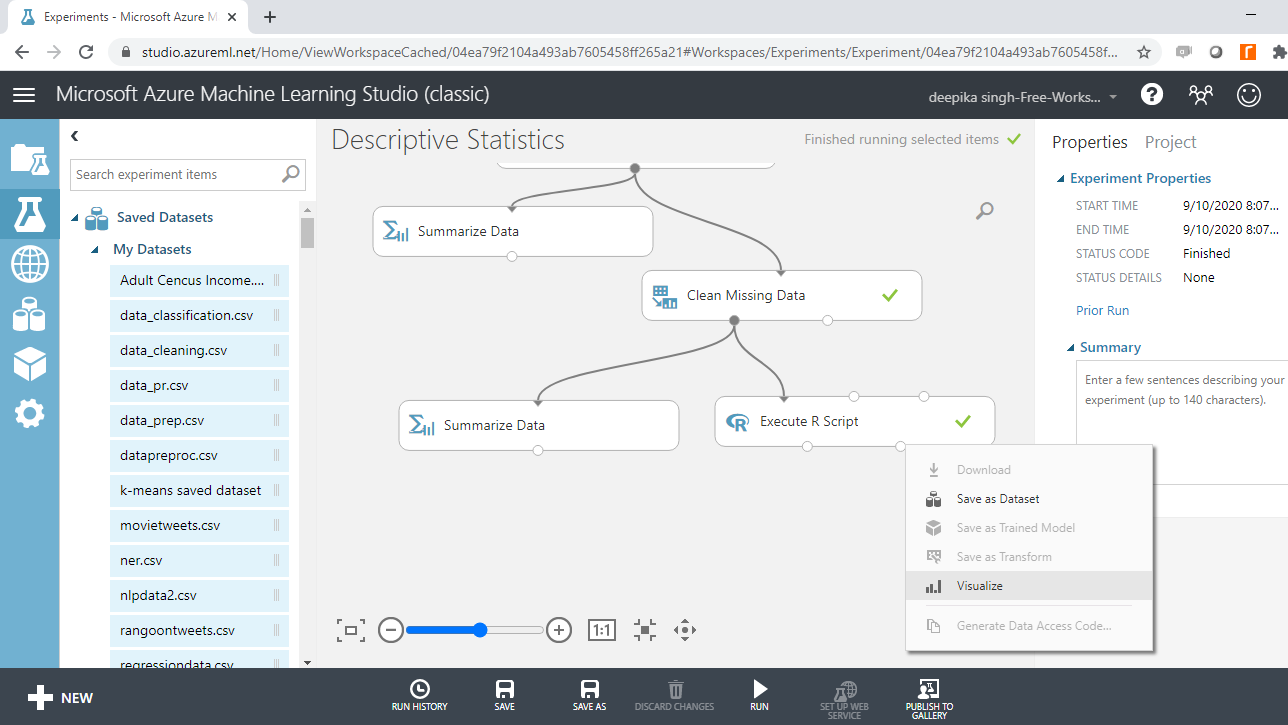
Search and drag the Clean Missing Data module into the experiment workspace. Connect the Edit Metadata module with the input port of the Clean Missing Data module.
On the right-hand side of the workspace, there are different options to perform the Clean Missing Data operation. There are several methods of dealing with missing values. One of the advanced techniques is using the MICE technique. MICE stands for multivariate imputation by chained equations, and it works by creating multiple imputations (replacement values) for multivariate missing data. Under the Cleaning mode tab, select the Replace using MICE option. Keep all the other options as default.
Run the experiment, and once the experiment run is completed, right-click and select Visualize. The following output is generated.
Now selecting any variable will display zero missing values. You will next summarize the data again with the Summarize Data module. Drag and connect the module with the Clean Missing Data module, and run the module.
Once the module run is completed, right-click and select the Visualize option.
The output below shows that the missing values have been treated.
Basic Statistics with R Module
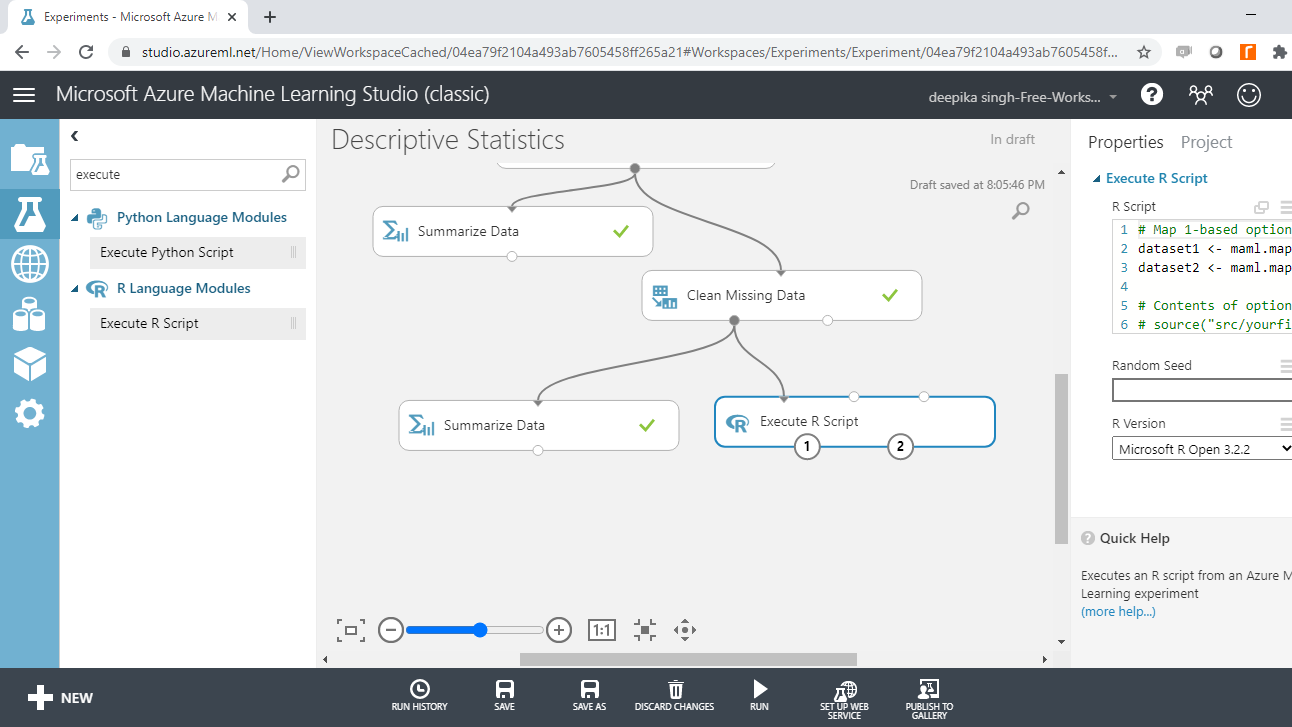
You can use the summary() function in R to print the summary statistics of all the variables. The Execute R Script module can be used to execute R codes in the machine learning experiment.
To begin, search and add the Execute R Script module to your experiment. Next, connect the data to the first input port (left-most) of the Execute R Script module.
Click on the module and under the ** Properties** pane, you will see the option of writing your R script. Enter the code as shown below.
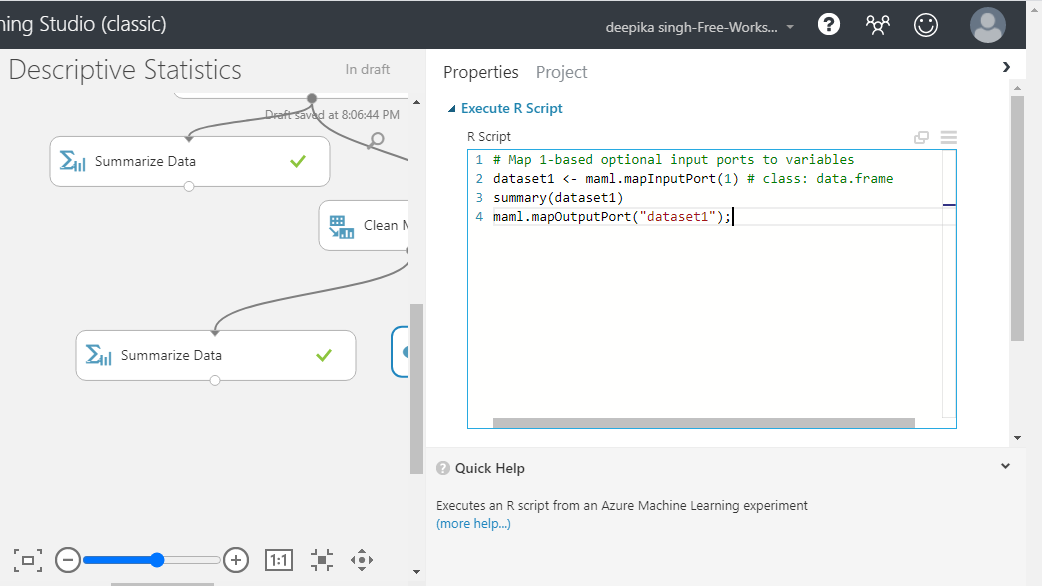
You can also copy the code from below.
      dataset1 = mam1.mapInputPort(1)
summary(dataset1)
mam1.mapOutputPort(“dataset1”);
Run the experiment and on successful completion, right-click and select Visualize to look at the data again.
Completing the above steps will generate the following output.
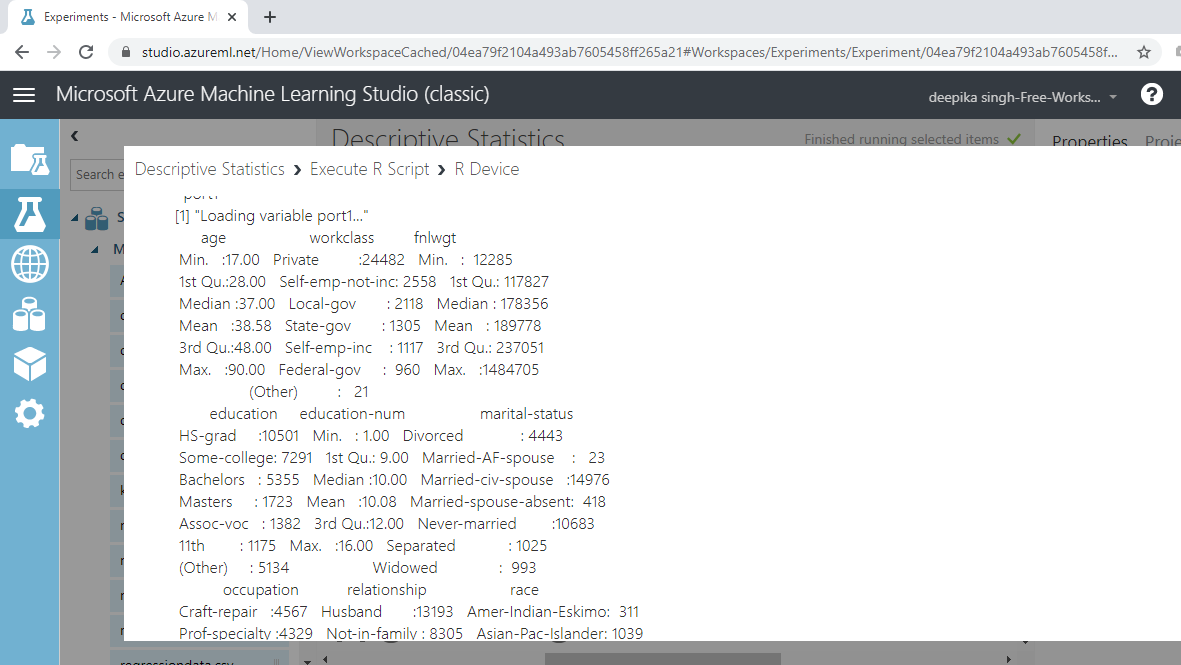
The output above prints the summary statistics of both numerical and categorical variables. For example, the variable workclass has the highest frequency of 24,482 for the label Private. This is the mode for the variable.
Conclusion
Descriptive statistics have multiple applications. They are used in descriptive analytics, business intelligence, and preparing MIS reports. They are also used in the six sigma quality assurance domain, where control limits are defined using summary statistical measures. Descriptive statistics are also used in exploratory data analysis, an important task of machine learning.
In this guide, you learned how to generate descriptive statistics for a dataset in Azure Machine Learning Studio. You can learn more about this concept with guides on other technologies like Python and R.
To learn more about data science and machine learning using Azure Machine Learning Studio, please refer to the following guides:
Advance your tech skills today
Access courses on AI, cloud, data, security, and more—all led by industry experts.
