Use Background Images as Custom Maps in Tableau
Aug 6, 2020 • 7 Minute Read
Introduction
Background images are images that are displayed underneath data. They are used to add more context to the data in view. A common use is adding custom map images that correspond to a coordinate system.
Tableau provides a great feature to use background images as custom maps. This means that the image will be like a map in the background, and the co-ordinates will be plotted on it. In this guide, you will learn how to use background images as custom maps in Tableau.
Data
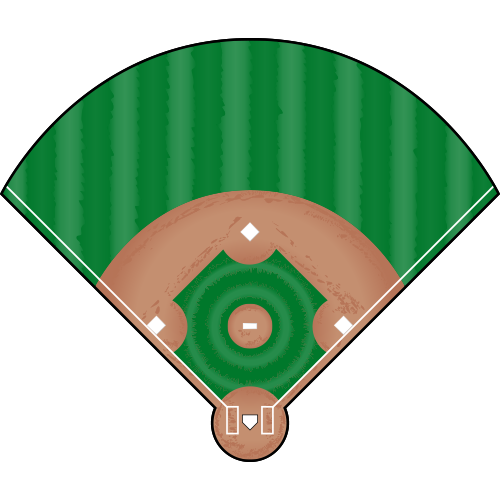
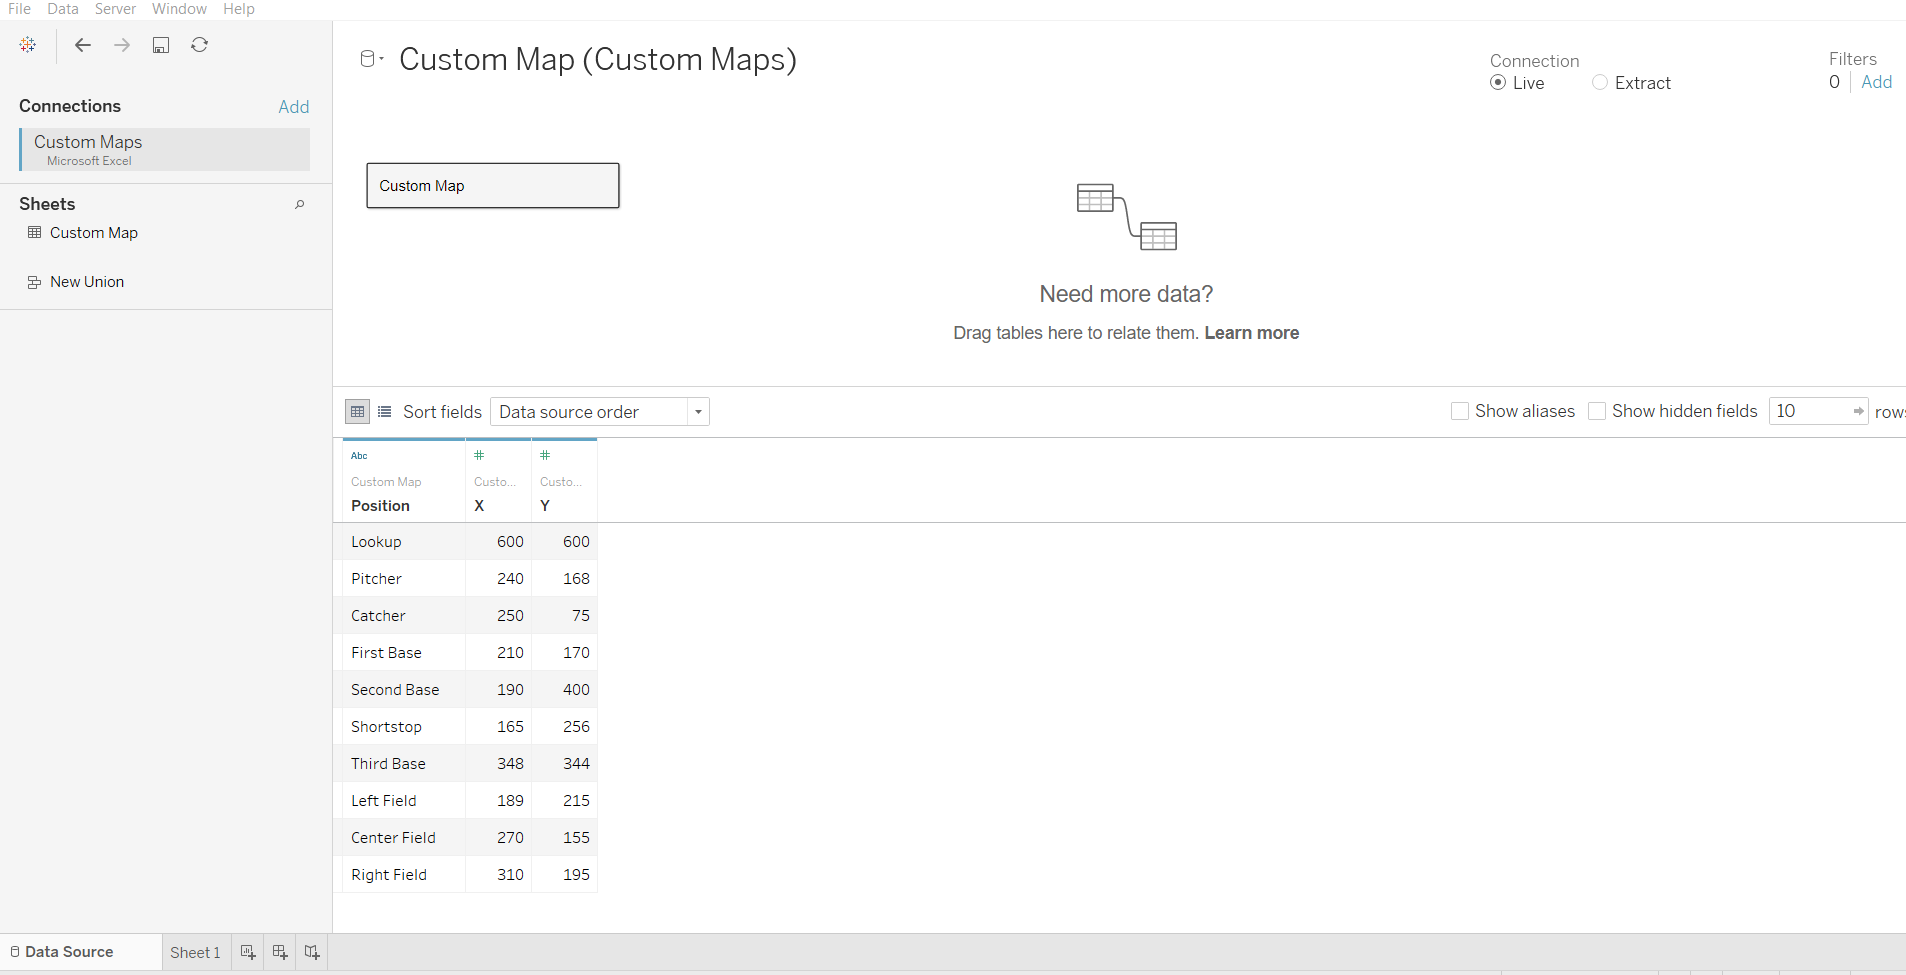
To implement the background images as the custom maps, you will require a background image against which the coordinates will be plotted. This guide will use a fictitious data set that consists of three fields: the Position of the baseball and its respective X and Y co-ordinates.
For the background image, you will use the baseball diamond as shown below.
Steps
To begin, you will load the data. For this, open Tableau desktop and look at the Connect pane.
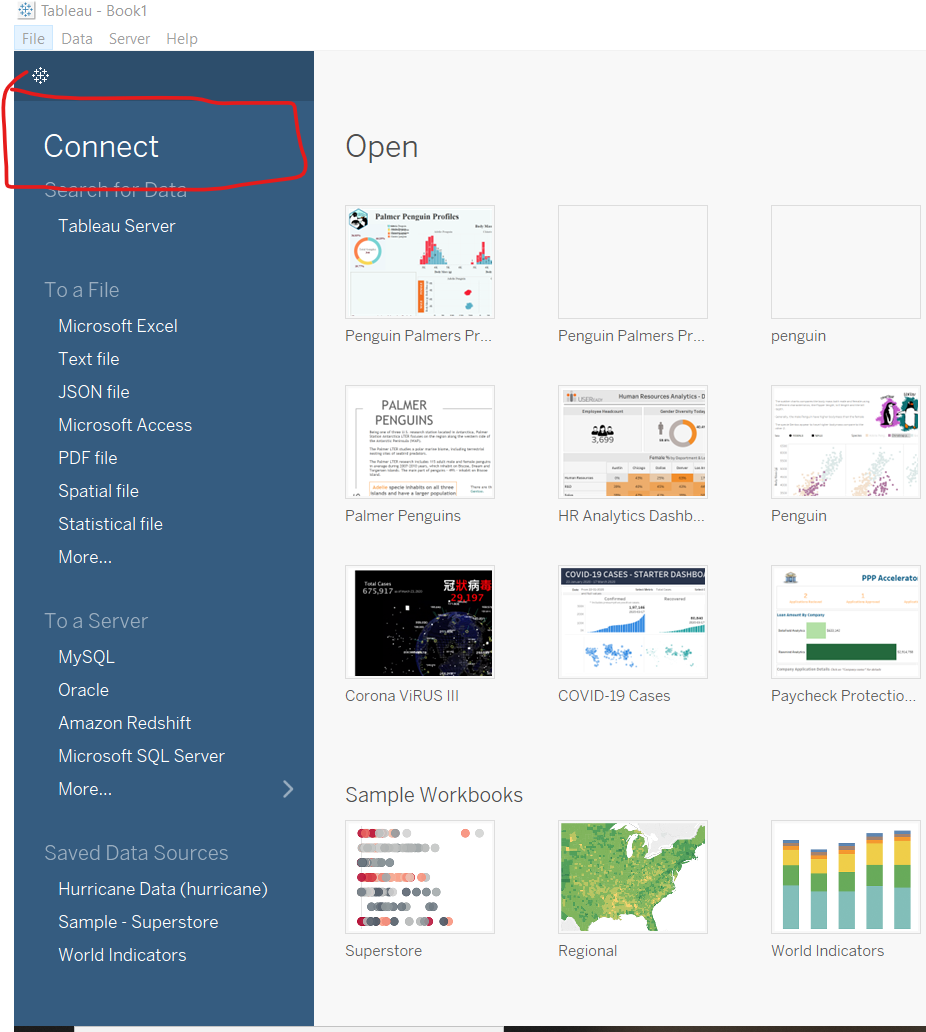
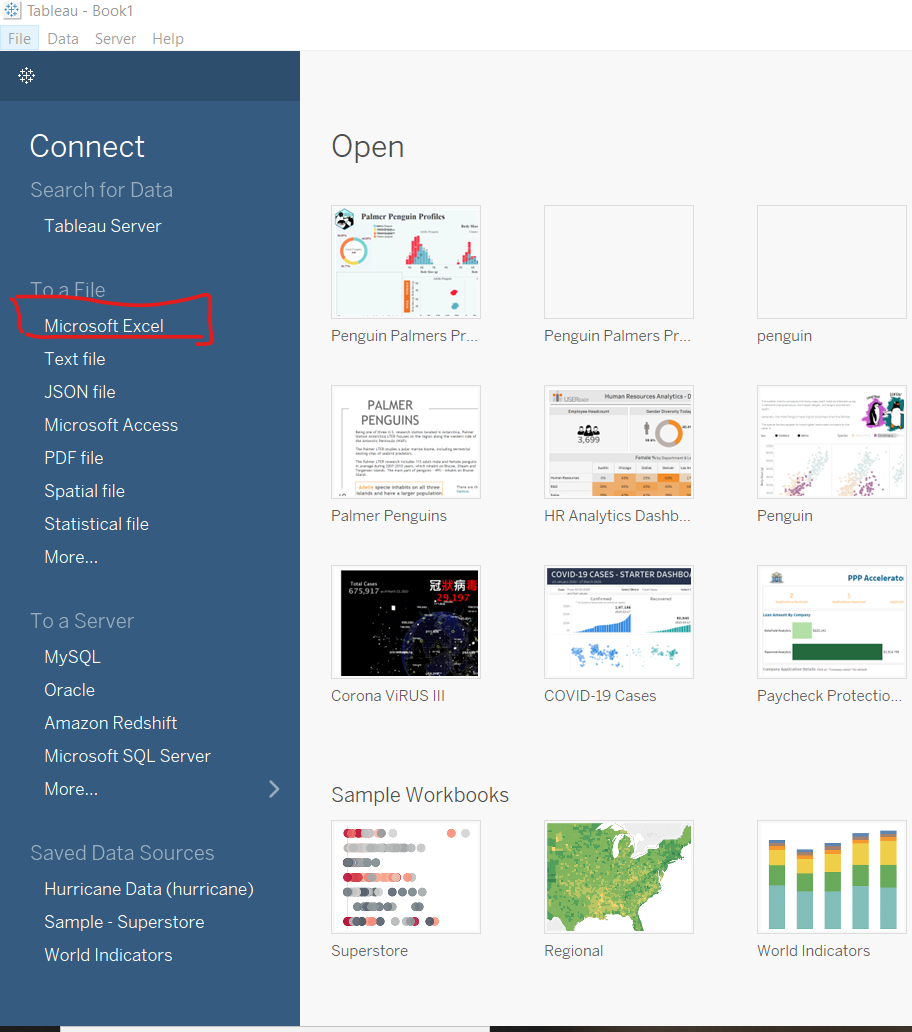
Next, select Microsoft Excel from the To a File option.
Browse to the location of the file in your system and select the file, which is named Custom Maps in this example. Next, drag the Custom Maps file from the Sheets option in the left corner of the screen. Place the file into the canvas as shown below.
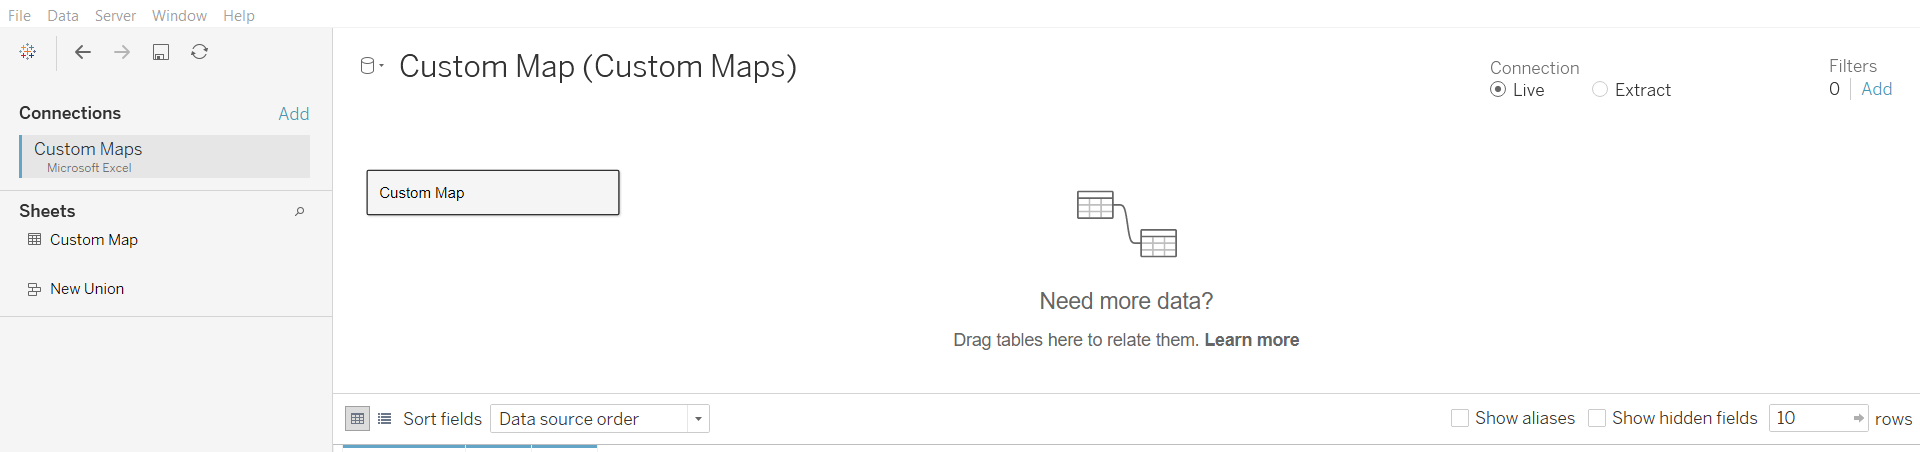
The lower portion of the canvas displays the first one thousand rows of the data. In this case, the data has only ten data points as shown below.
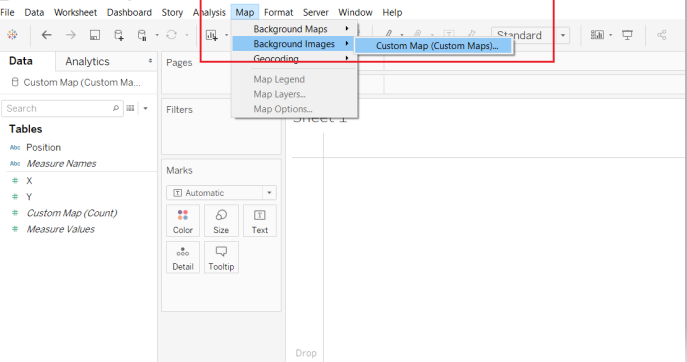
After loading the data in Tableau, the next step is to import the background image for the custom maps. To do this, go to the Map tab in toolbar of the Tableau interface. Next, select Background Images from the options, and select Custom Map.
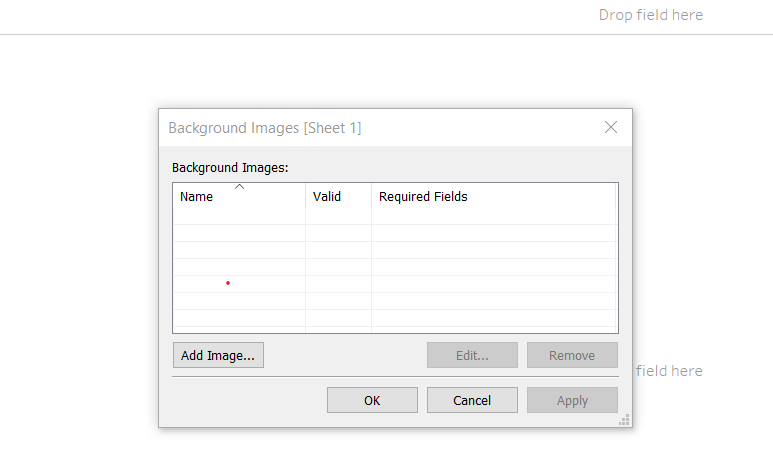
Completing the above step will open a pop-up for adding the image. Click on the Add Image option.
A new pop-up window will appear on clicking the Add Image option. Next, provide the path to the file location for the background image you want to use. Also, highlight the columns representing the X Field and Y Field option, along with the highest X and Y coordinates.
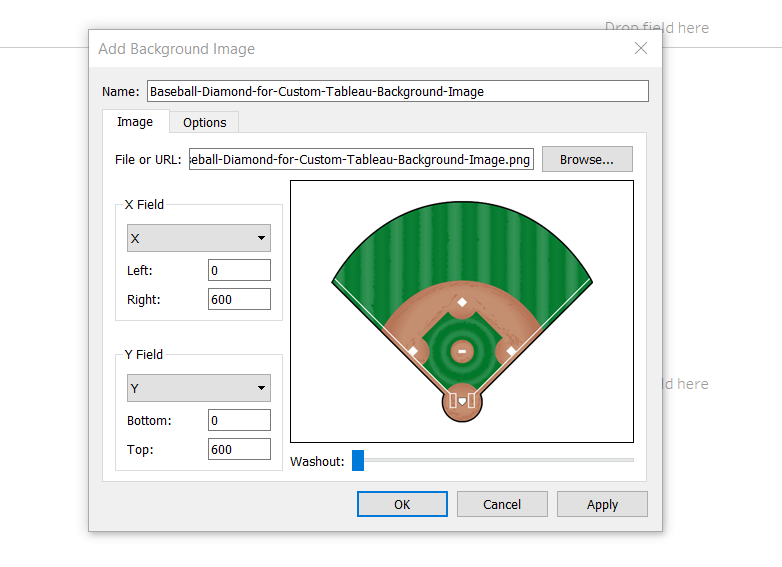
In the pop-up above, you have used the X field and Y Field names as X and Y, respectively. This is because that is the name of the columns in this data. For any other data, you will have to input different names accordingly.
Completing the above steps will set the background image. The next step is to drag the variable X into the Columns shelf and the variable Y into the Rows shelf.
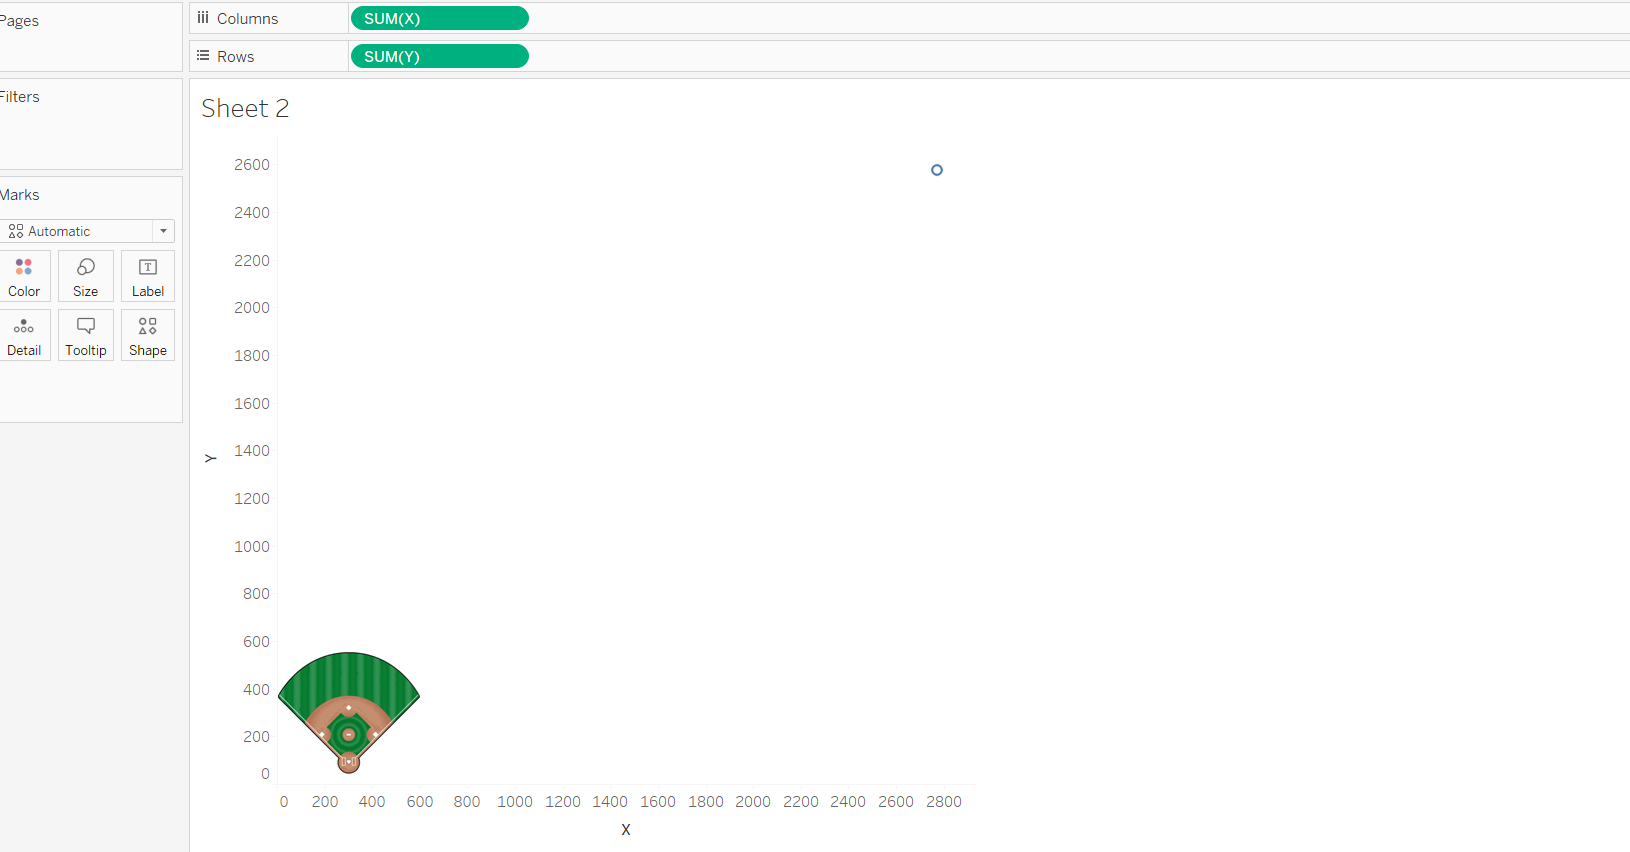
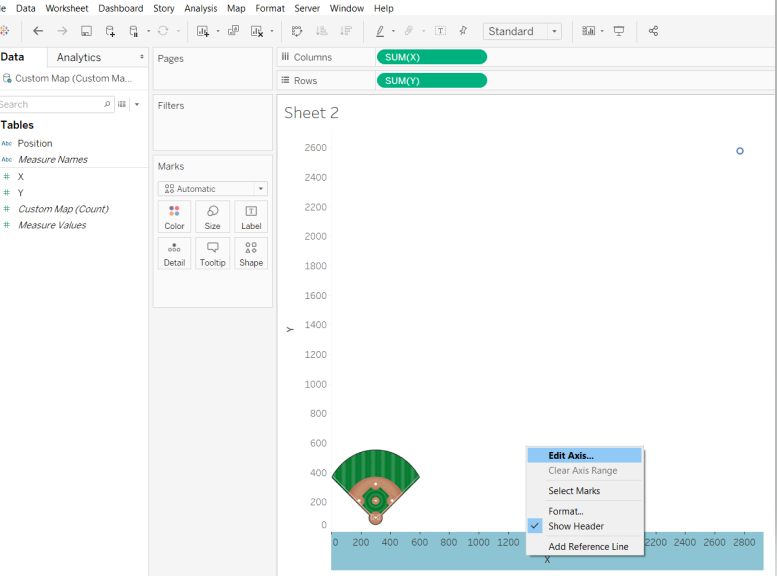
The above output shows that though you got the background image in the view, it's still not properly positioned. This is because the axes are not properly arranged. To do this, right click on the X axis, and select Edit Axis. This is shown below.
Enter the range in the pop-up as shown below.
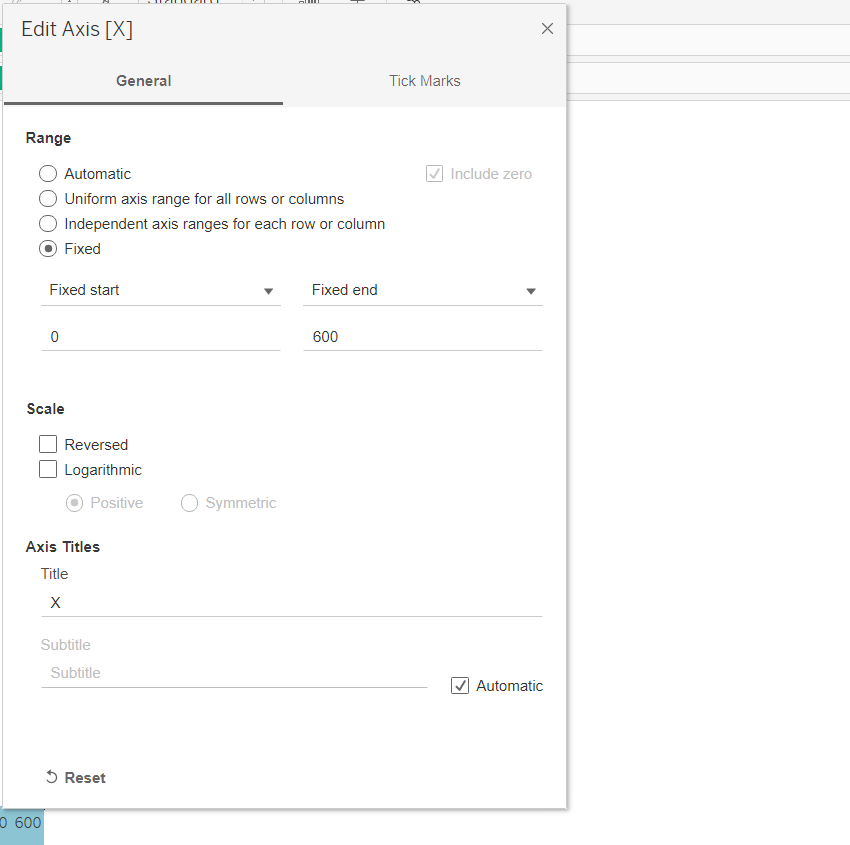
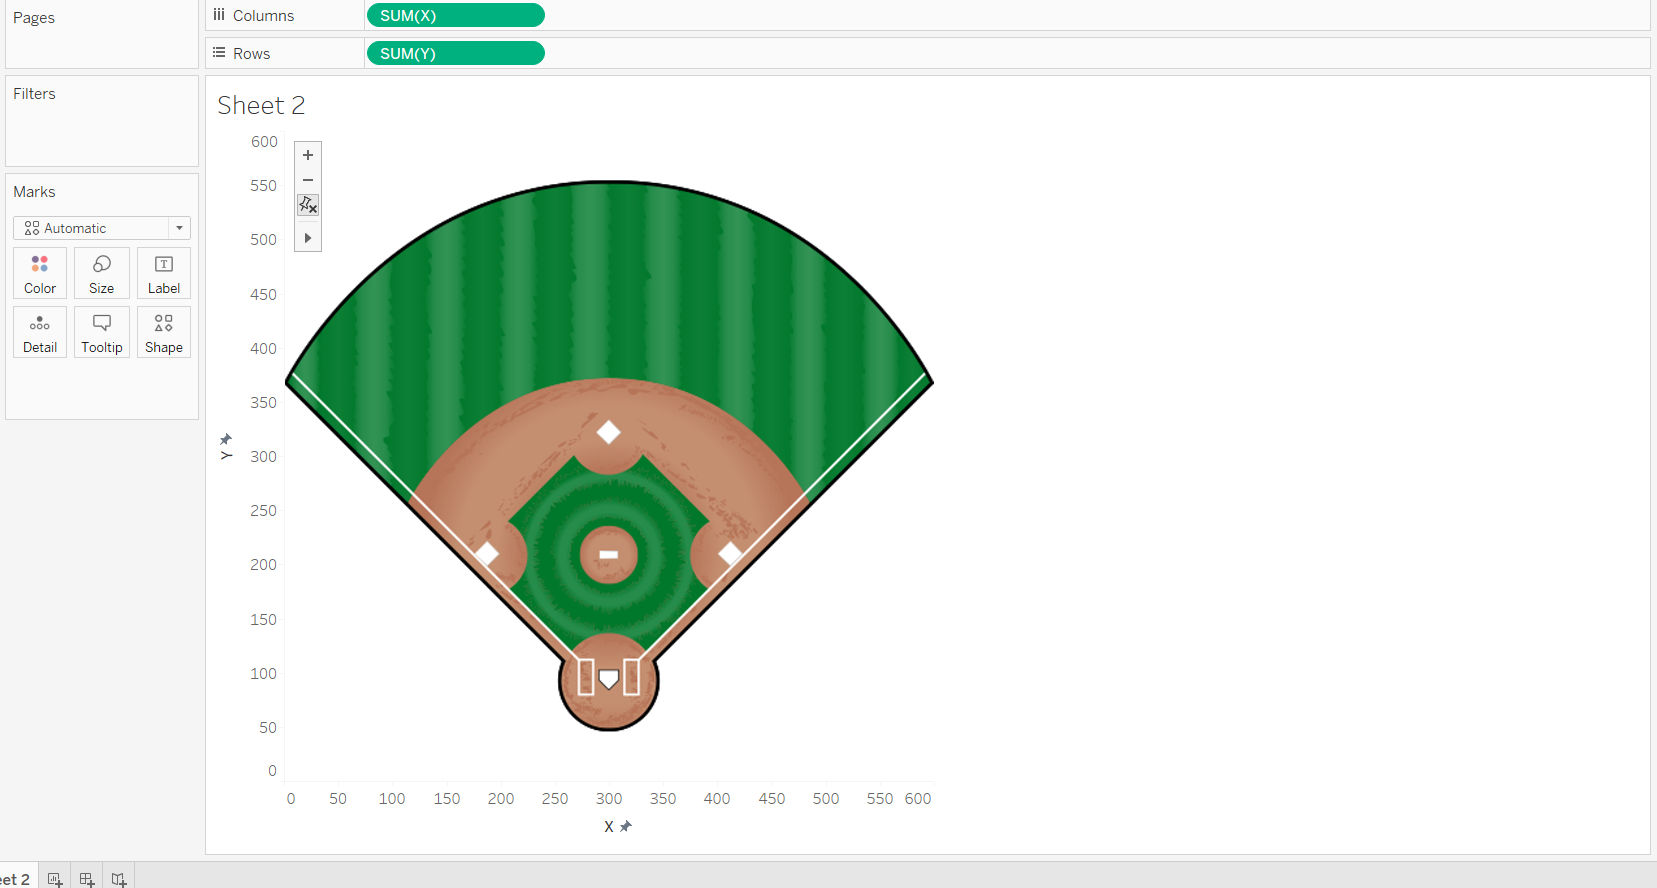
Repeat the same step with the Y axis and set the range from zero to six hundred. You can now see that the image is properly displayed in the view pane.
Next, drag the Position field in the Detail card of the Marks pane. This will display the coordinates in the background image.
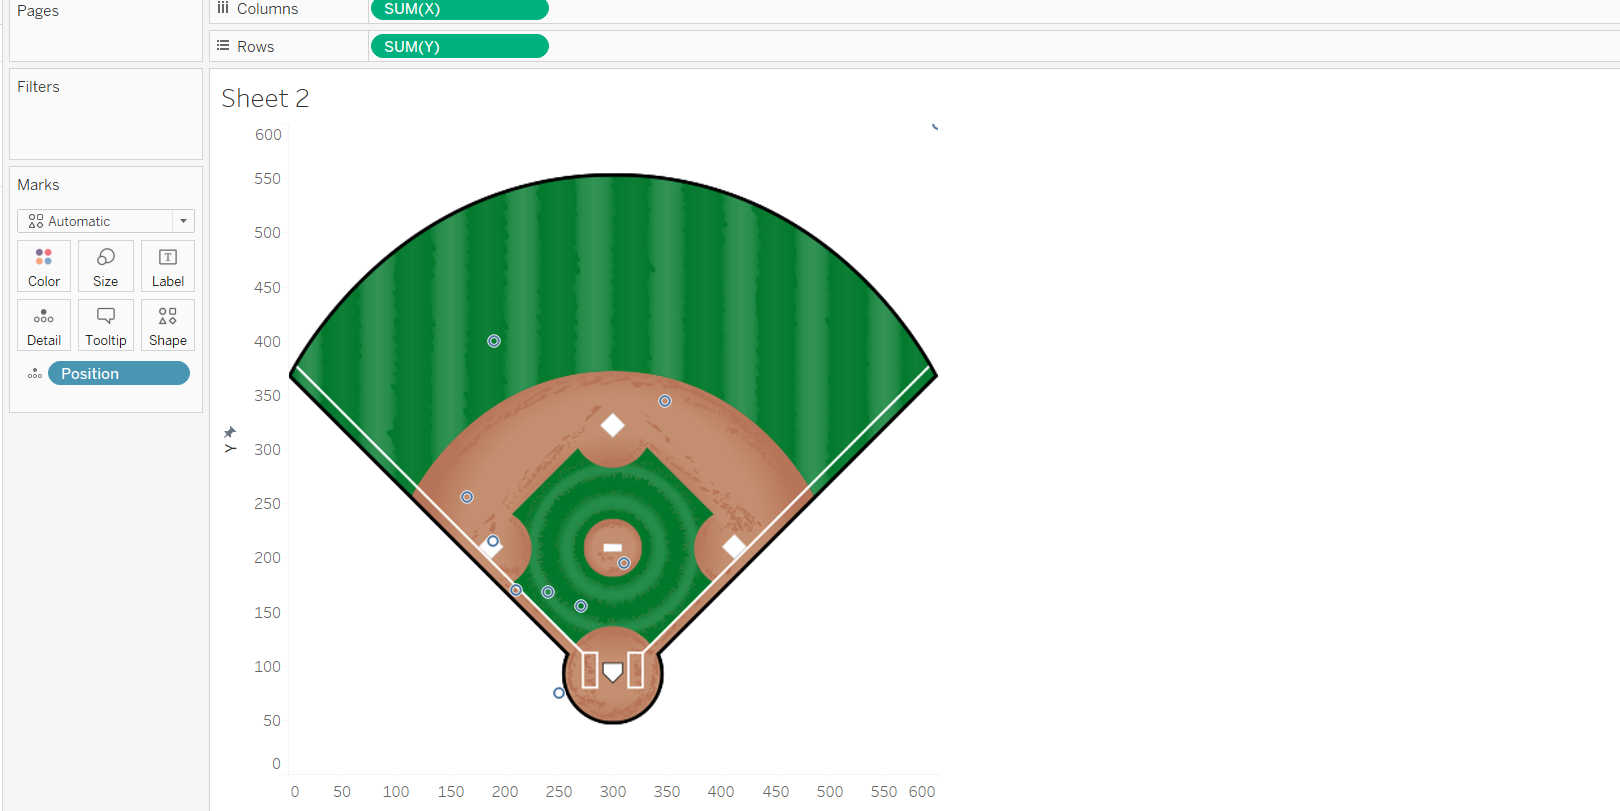
You are often required to pre-process the data while plotting it against the background images. One such pre-processing step is to exclude certain data points that are not adding any value. In this data, there are two points that will be excluded. The first point has X and Y coordinates of 600, while the second point is plotted outside the background image.
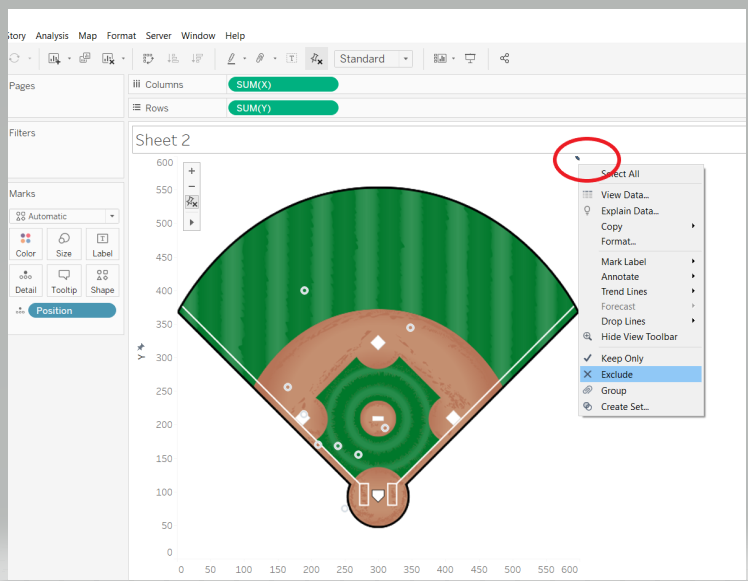
To exclude the data points, click on the point and select Exclude as shown below.
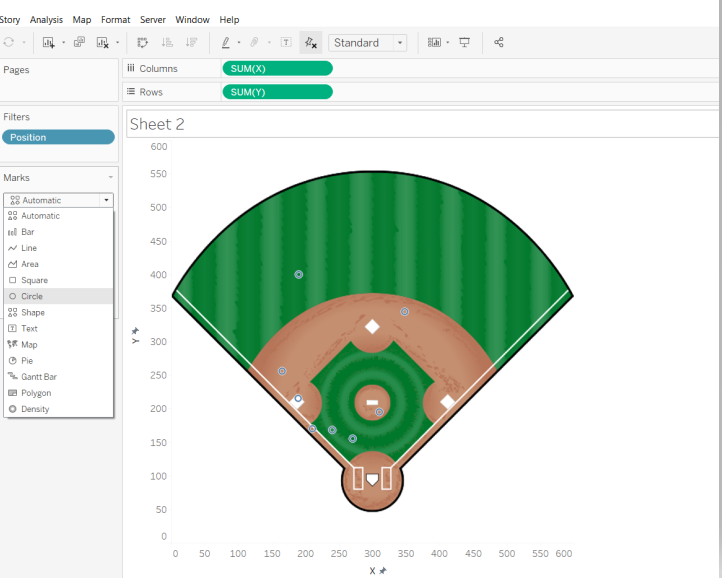
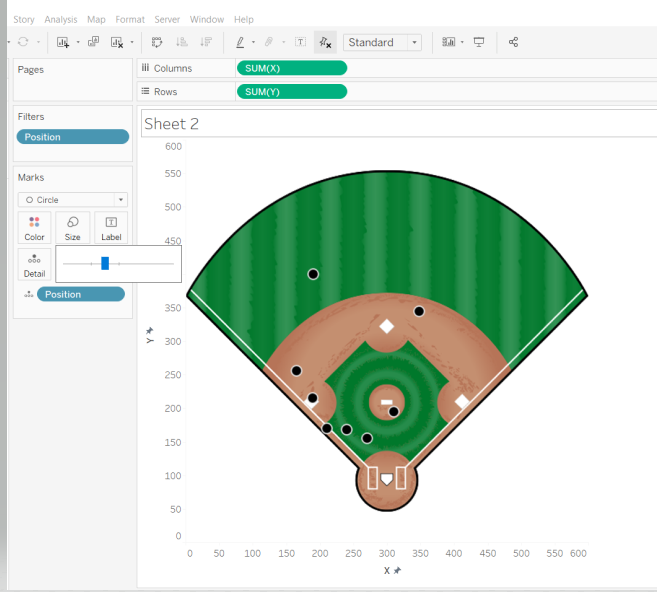
Repeat the same step for the other point to be excluded. Now you can see the points as circles. To increase the visibility, you will format the color. To begin, select the shape as shown below. This will select the filled circle option.
Next, select the dark black color.
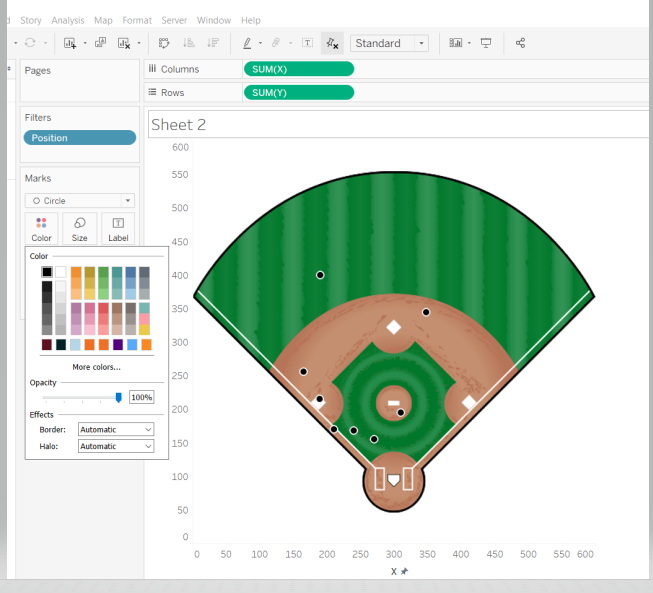
The output above shows that the color is changed to dark black. Next, increase the size of the circle with the Size property in the Marks card. This will generate the final output as shown below.
Conclusion
In this guide, you learned how to use background images as custom maps in Tableau. You also learned how to exclude unwanted coordinates from the map as well as format the image. This will help in strengthening your business intelligence capabilities.
To learn more about visualization and data analysis using Tableau, please refer to the following guides:
Advance your tech skills today
Access courses on AI, cloud, data, security, and more—all led by industry experts.
