- Course
Build Visualizations and Dashboards in Kibana 7
The quote “Data is the new oil” makes sense only if you know how to harness the information behind the data and monetize it. This course will teach you how to crunch your data and create meaningful visualizations to make effective business decisions.
Get started today
Access this course and other top-rated tech content with one of our business plans.
Try this course for free
Access this course and other top-rated tech content with one of our individual plans.
This course is included in the libraries shown below:
- Security
What you'll learn
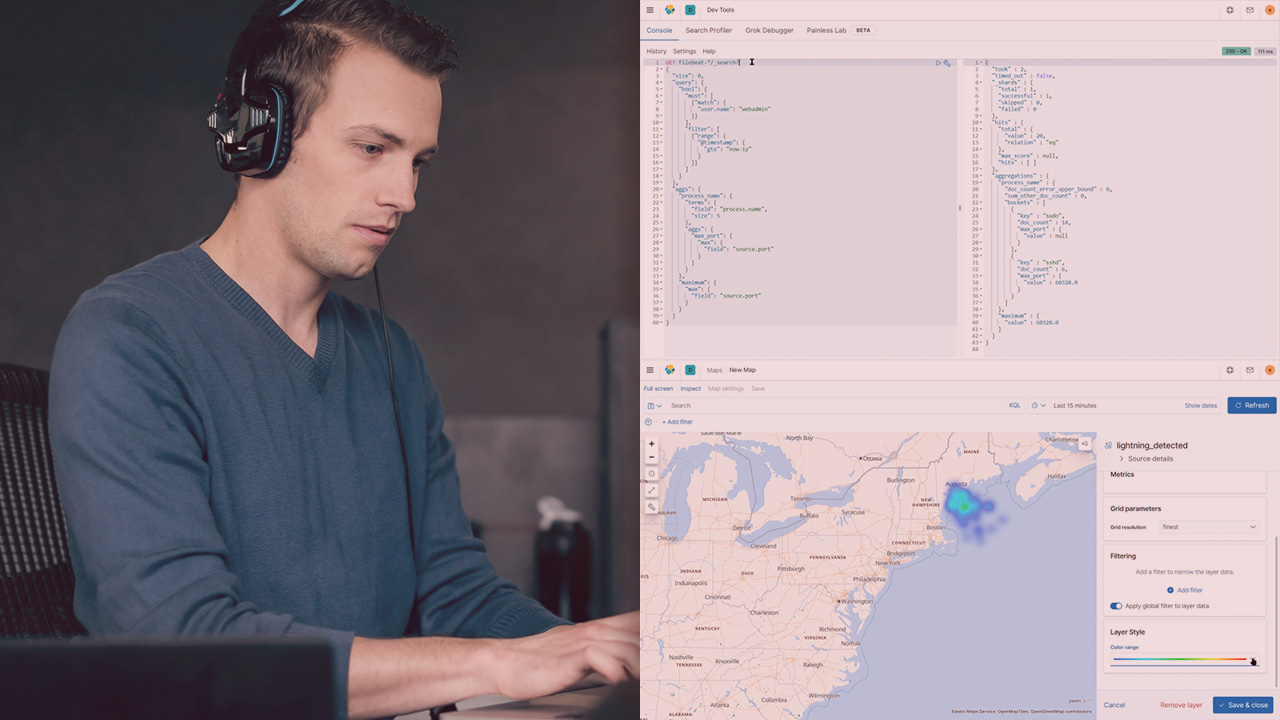
As corporations grow in size, it’s paramount to leverage the power of data to make educated business decisions. In this course, Build Visualizations and Dashboards in Kibana, you’ll learn to harness the power of data and derive meaningful insights. First, you’ll explore how datais aggregated in Elasticsearch. Next, you’ll discover how to perform simple visualizations using line, area, and bar charts. Then, you will learn how to build complex visualizations using heatmaps, timelion, and TSVB. Finally, you will learn how to build dashboards using the charts and create drilldowns between them. When you’re finished with this course, you’ll have the skills and knowledge of creating dynamic visualizations needed to derive information from the data effectively.

