
- Course
Geospatial Mapping with D3
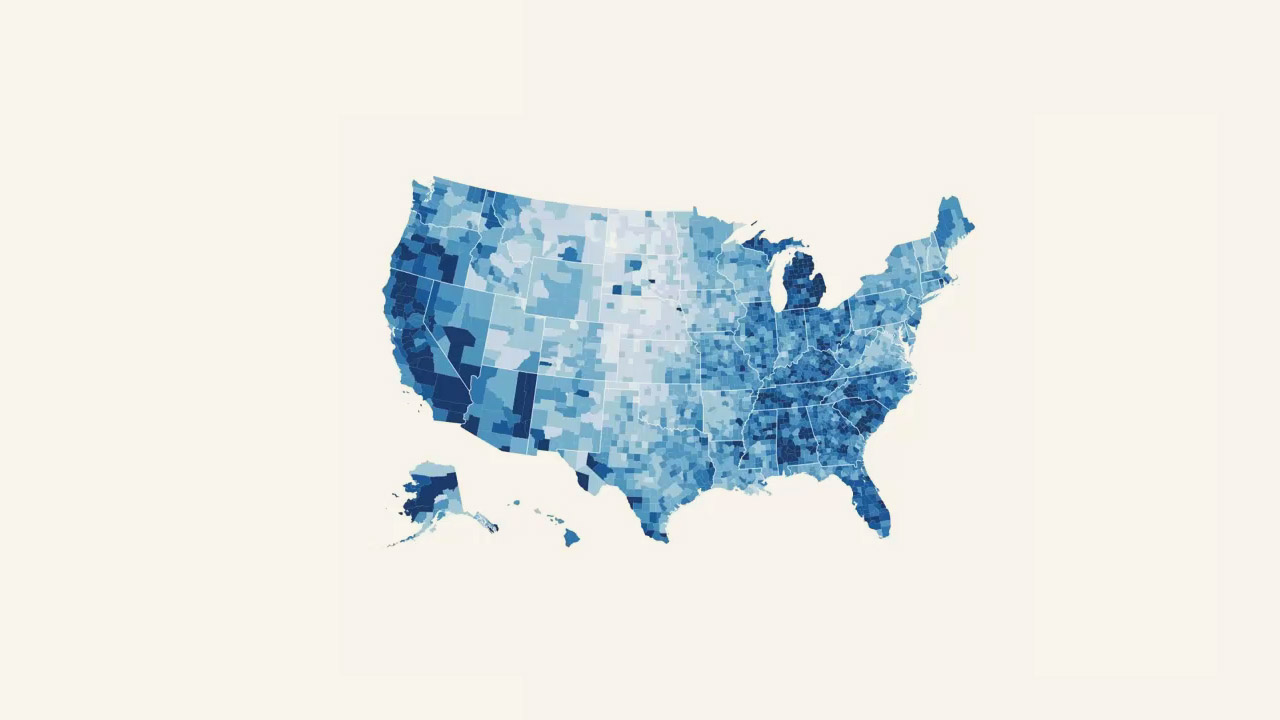
Learn how to work with and visualize Geospatial data in D3. You'll start from scratch with shapefiles found online, combine it with CSV data, then visualize it in simple yet beautiful ways.
Intermediate
- Course
Geospatial Mapping with D3
Learn how to work with and visualize Geospatial data in D3. You'll start from scratch with shapefiles found online, combine it with CSV data, then visualize it in simple yet beautiful ways.
Intermediate
Get started today
Access this course and other top-rated tech content with one of our business plans.
Try this course for free
Access this course and other top-rated tech content with one of our individual plans.
This course is included in the libraries shown below:
- Data
What you'll learn
Create maps that are beautiful as well as geospatially accurate. In this course, Geospatial Mapping with D3, you'll learn the concepts behind geospatial data and the world of cartography, which has been around for centuries! First, you'll gain an understanding of how maps are built, how the cartographers of the world use maps, and then you'll dig into functionally working with this data using open source tools to process your shapefiles into something you can draw in D3. Next, you'll learn how to convert files to various formats, clip files to a specific area, filter files down using SQL-like syntax, and simplify the output of files. Once you have our data pulled together and format ready to draw in D3, you'll dive into drawing maps with TopoJSON, combining data from a fictitious company's sale system and your topojson data. When you finish this course, you'll have the practical skills needed to make beautiful and useful maps in D3.
Geospatial Mapping with D3
Intermediate
I work as a feedback mechanism for organizations and teams to help them understand what’s going on with their products and processes. I do this by collecting and organizing their data, visually exploring it, enriching it with other data and metrics, then presenting my findings using creative information design techniques. This leads to improved business performance and often sparks a data-driven culture throughout my clients organizations.
