
- Course
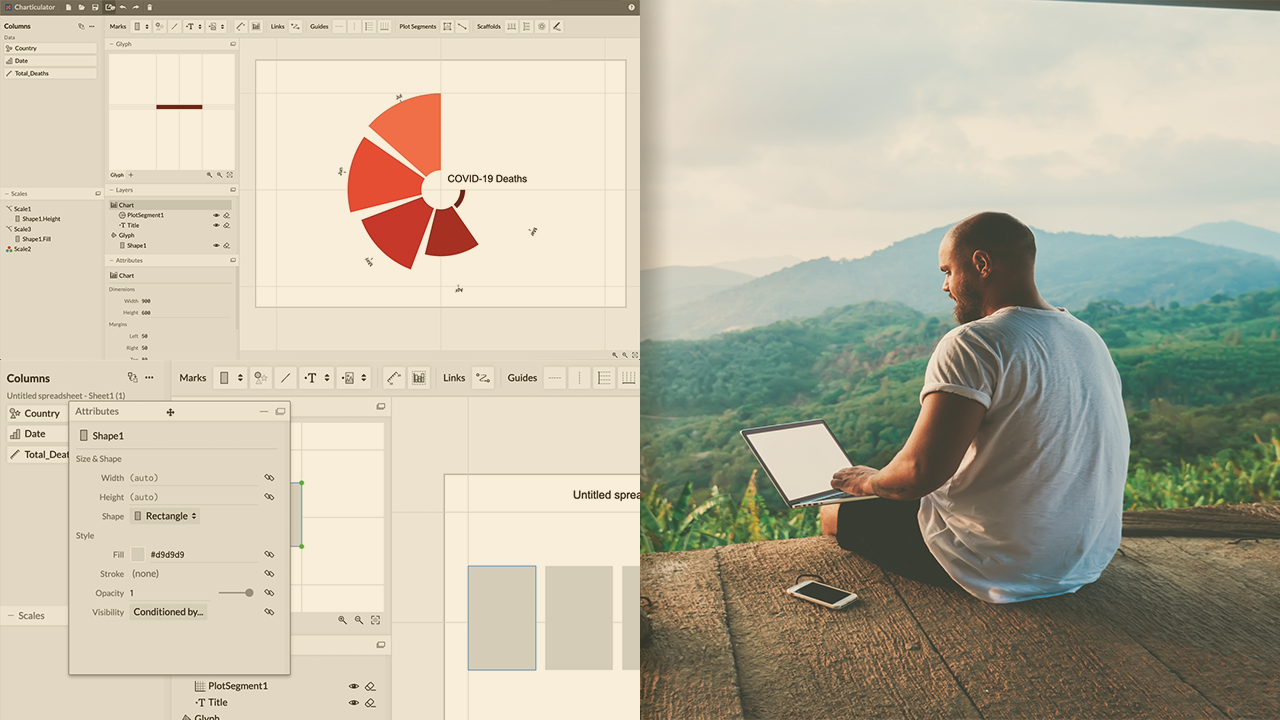
Build Your First Data Visualization with Charticulator 1
This course will be going over all the features Charticulator has to offer and how simple they are to use.
Beginner
- Course
Build Your First Data Visualization with Charticulator 1
This course will be going over all the features Charticulator has to offer and how simple they are to use.
Beginner
Get started today
Access this course and other top-rated tech content with one of our business plans.
Try this course for free
Access this course and other top-rated tech content with one of our individual plans.
This course is included in the libraries shown below:
- Data
What you'll learn
Data professionals often need to take complex data and visualize it. In this course, Build Your First Data Visualization with Charticulator, you will go over all the features of Charticulator and what is can offer. First, you will explore how to load data. Next, you will discover how to create custom visualizations. Finally, you will go over how to export to Power BI. By the end of this course, you will have a better grasp on using Charticulator to bring data visualizations to life.
Build Your First Data Visualization with Charticulator 1
Beginner
Table of contents
Troy Kranendonk is a Principal Data Author with extensive experience in data analysis, business intelligence, and the art of data visualization. Troy focuses on data education, excelling in content creation and sharing his expertise to help others understand and visualize data effectively.
