
- Course
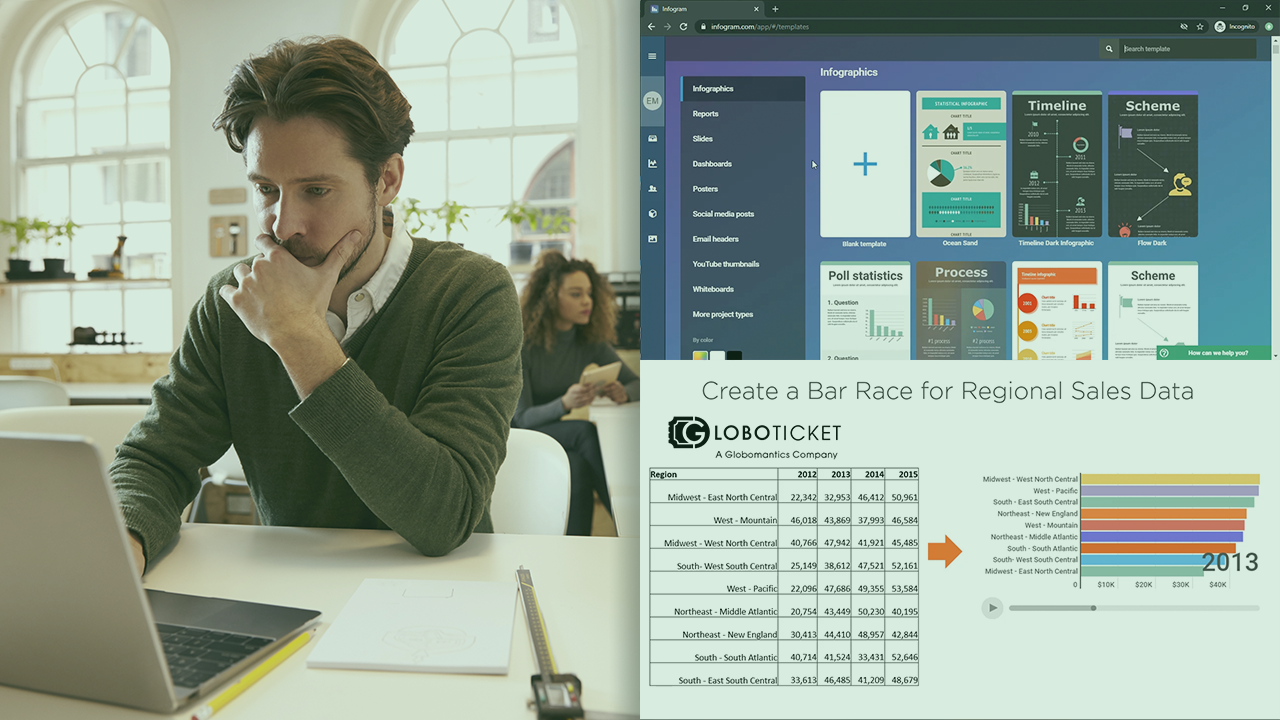
Build Your First Data Visualization with Infogram
This course will teach you how to create impactful infographics for data analysis using Infogram.
Beginner
- Course
Build Your First Data Visualization with Infogram
This course will teach you how to create impactful infographics for data analysis using Infogram.
Beginner
Get started today
Access this course and other top-rated tech content with one of our business plans.
Try this course for free
Access this course and other top-rated tech content with one of our individual plans.
This course is included in the libraries shown below:
- Data
What you'll learn
Create a powerful geographical analysis that summarizes data with Infogram. In this course, Build Your First Data Visualization with Infogram, you’ll learn to create simple and effective maps for geographical summaries of data. First, you’ll explore the datasets needed for the business problem. Next, you’ll discover how to format and import data from excel. Finally, you’ll learn how to show a map and a bar race that explains geographical data. When you’re finished with this course, you’ll have the skills and knowledge of infographics needed to present data summaries for businesses and organizations.
Build Your First Data Visualization with Infogram
Beginner
Emilee has an M.S. in Business Statistics from Mercer University and currently works as a Data Scientist. She has worked with data for 5+ years, spending the majority of her time in financial industry. She created marketing solutions at an investment management firm, consulted with lenders on risk models at a credit bureau, and currently works in consumer banking. Through her love of data, she has always had a passion for teaching. Prior to grad school, she worked as a teacher.
