
- Course
Building Reports, Dashboards, and Alerts in Splunk
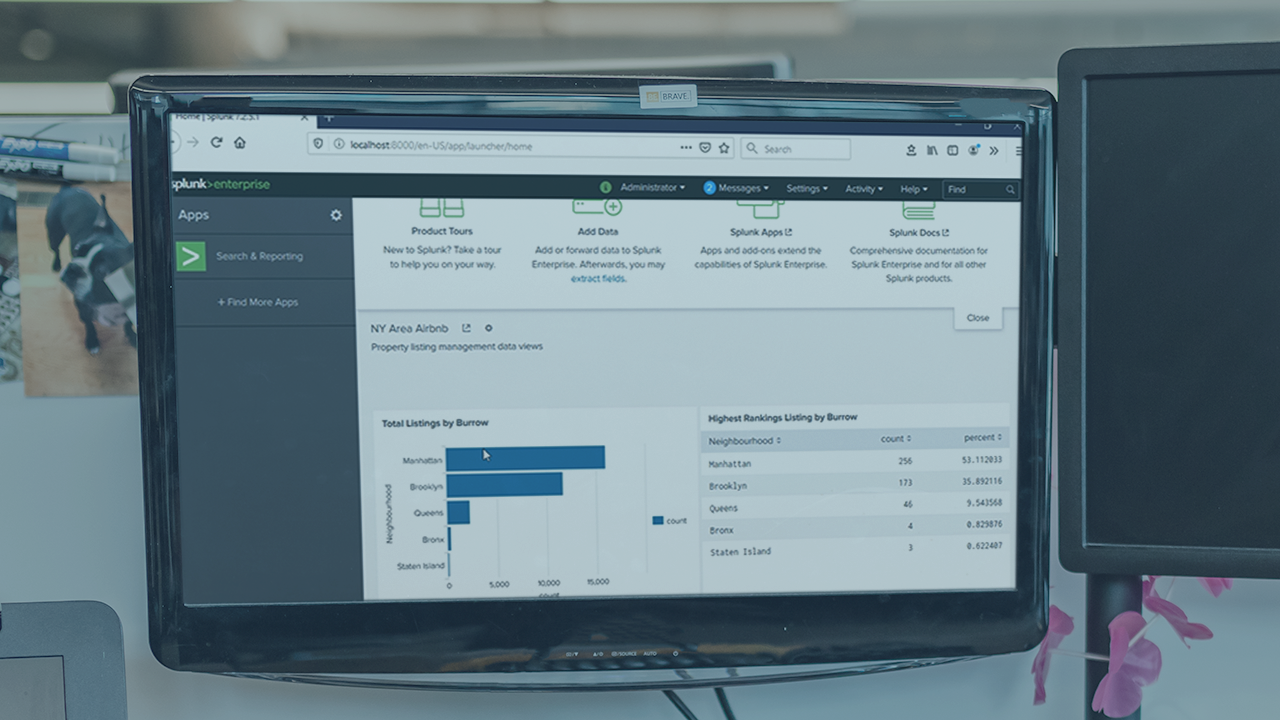
In this course you will learn how to build powerful visualizations from Splunk searches. Splunk reports and dashboards can be built to share with Splunk users to save Splunk administrators time.
Beginner
- Course
Building Reports, Dashboards, and Alerts in Splunk
In this course you will learn how to build powerful visualizations from Splunk searches. Splunk reports and dashboards can be built to share with Splunk users to save Splunk administrators time.
Beginner
Get started today
Access this course and other top-rated tech content with one of our business plans.
Try this course for free
Access this course and other top-rated tech content with one of our individual plans.
This course is included in the libraries shown below:
- Core Tech
What you'll learn
Visualizations in data analytics can make or break users' understanding of machine generated data. In this course, Building Reports, Dashboards, and Alerts in Splunk, you will gain the ability to build reports, dashboards, and alerts in Splunk. First, you will learn how to create Splunk reports. Next, you will begin to develop Splunk dashboards. Finally, you will explore how to build Splunk notifications and alerts. When you're finished with this course, you will have the skills and knowledge of Splunk visualizations needed to grow as a Splunk users or administrator.
Building Reports, Dashboards, and Alerts in Splunk
Beginner
Thomas is a Senior Software Engineer and Certified ScrumMaster. He spends most of his time working with the Hortonwork Data Platform and Agile Coaching.
