
- Course
Creating Reports with Power BI
Building a data-driven story is one of the core requirements for effective business decision-making. This course will teach you how to design and configure comprehensive reporting solutions with Microsoft Power BI.
Beginner
- Course
Creating Reports with Power BI
Building a data-driven story is one of the core requirements for effective business decision-making. This course will teach you how to design and configure comprehensive reporting solutions with Microsoft Power BI.
Beginner
Get started today
Access this course and other top-rated tech content with one of our business plans.
Try this course for free
Access this course and other top-rated tech content with one of our individual plans.
This course is included in the libraries shown below:
- Data
What you'll learn
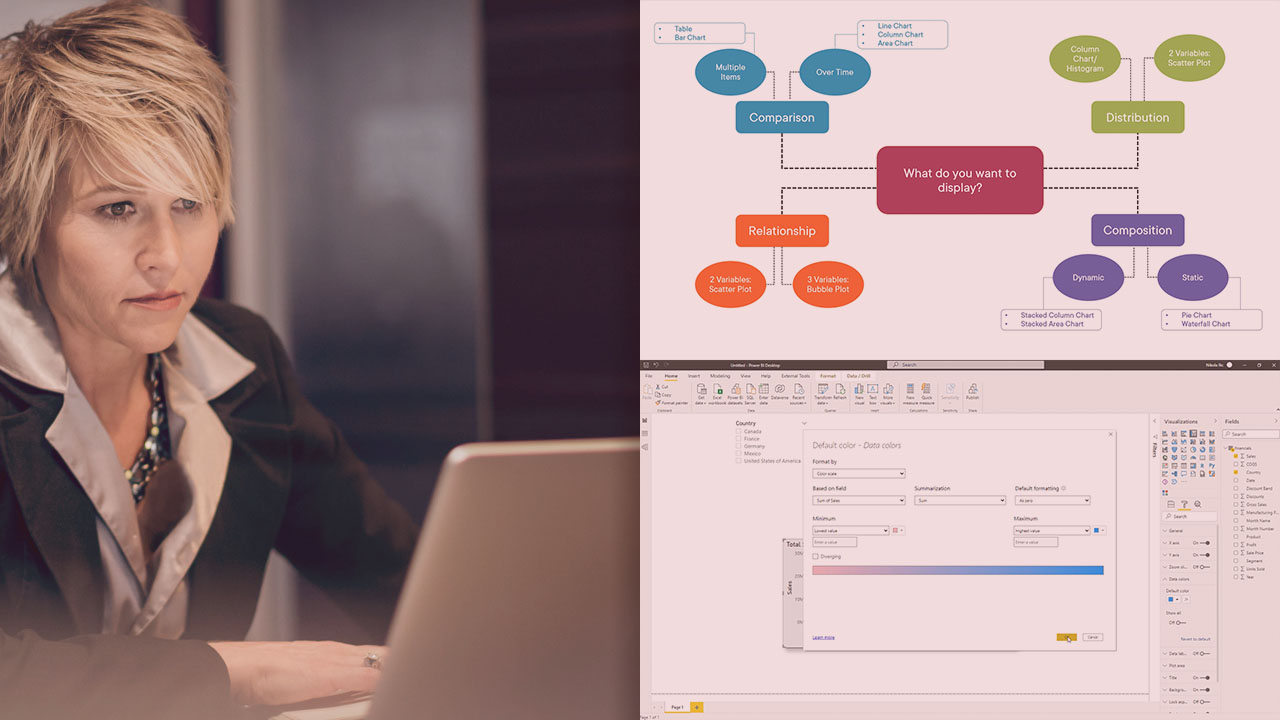
You learned the basics of Power BI: how to connect to different data sources, bring the data into Power BI Desktop, shape, and transform your data. Now it’s time to pull all that together and build impactful and compelling data stories with reports. In this course, Creating Reports with Power BI, you’ll learn to create effective data-driven stories. First, you’ll explore different visualization types and in which scenario to use each of them. Next, you’ll discover how to configure various report properties, such as conditional formatting, or automatic page refresh. Finally, you’ll learn how to design for accessibility and build a special report type: Paginated report. When you’re finished with this course, you’ll have the skills and knowledge of creating impactful reports in Power BI needed to support data-driven stories, and get you ready for the DA-100 exam.
Creating Reports with Power BI
Beginner
Table of contents
Nikola has multi-year experience working with various flavors of data, predominantly with Microsoft BI stack. Started with SQL Server, then brushed himself with SSAS Multidimensional, SSIS, SSRS, Power BI, Azure, etc. Nikola is really curious by nature and always trying to learn something new.
