
- Course
Creating Visualizations Using Base R Graphics
This course will teach you how to create visualizations for a variety of datasets new and old. From bar charts to a histogram and even plotting the function of a line, you will make an impact quickly in businesses and organizations.
Beginner
- Course
Creating Visualizations Using Base R Graphics
This course will teach you how to create visualizations for a variety of datasets new and old. From bar charts to a histogram and even plotting the function of a line, you will make an impact quickly in businesses and organizations.
Beginner
Get started today
Access this course and other top-rated tech content with one of our business plans.
Try this course for free
Access this course and other top-rated tech content with one of our individual plans.
This course is included in the libraries shown below:
- Data
What you'll learn
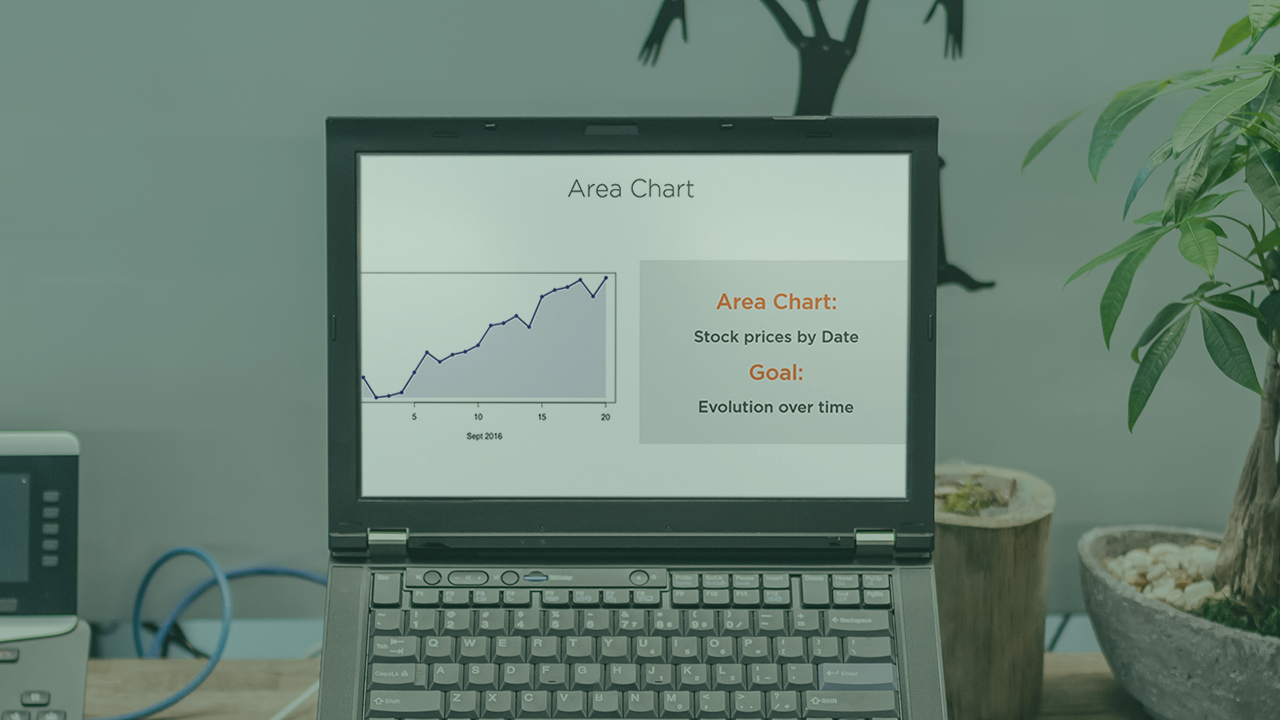
Creating great visuals can be time consuming when using multiple packages. In this course, Creating Visualizations Using Base R Graphics, you will gain the ability to create powerful visuals that fit your dataset and business goals. First, you will learn simple charts such as a bar plot. Next, you will discover more complex charts including an area graph. Finally, you will explore how to create statistical graphs for deeper data analysis. When you are finished with this course, you will have the skills and knowledge to produce and customize visualizations needed to present insights quickly.
Creating Visualizations Using Base R Graphics
Beginner
Emilee has an M.S. in Business Statistics from Mercer University and currently works as a Data Scientist. She has worked with data for 5+ years, spending the majority of her time in financial industry. She created marketing solutions at an investment management firm, consulted with lenders on risk models at a credit bureau, and currently works in consumer banking. Through her love of data, she has always had a passion for teaching. Prior to grad school, she worked as a teacher.
