
- Course
Data Literacy: Essentials of Power BI
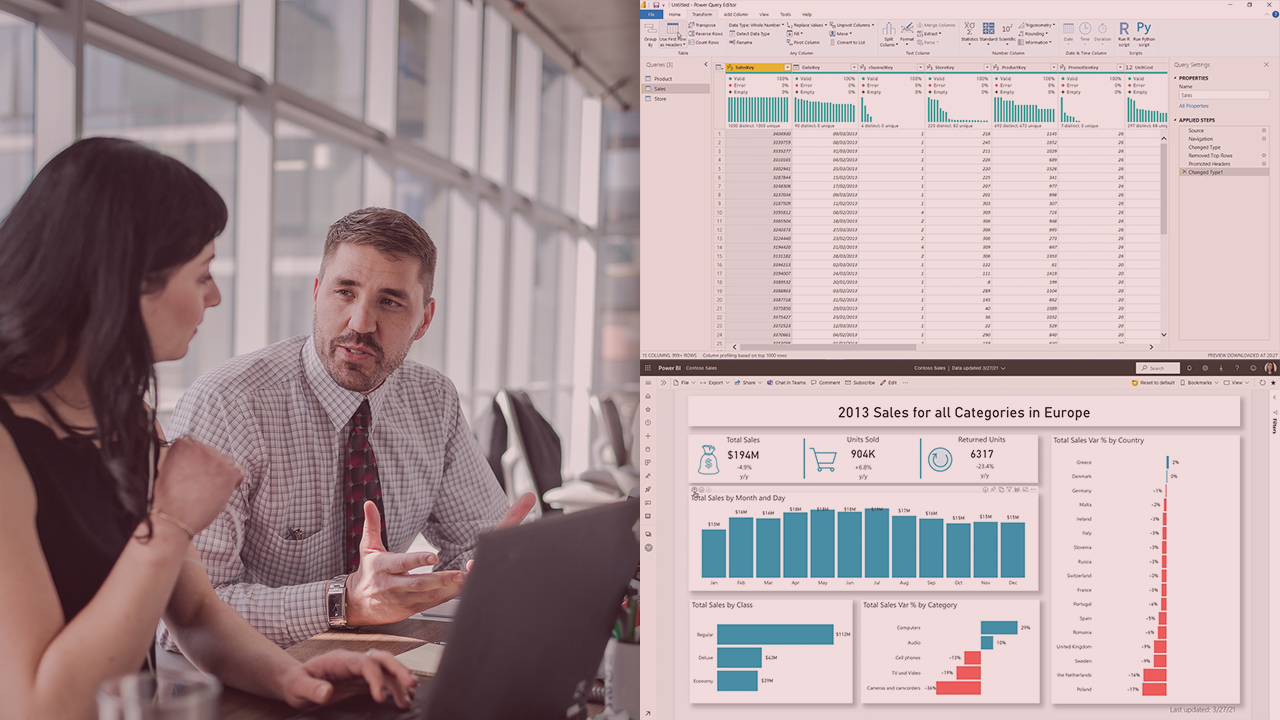
Data opens up a lot of opportunities, and Power BI can support you in a full data analysis workflow. This course will teach you how to explore content created in Power BI by your teammates. You’ll also learn how to create your first graph.
Beginner
- Course
Data Literacy: Essentials of Power BI
Data opens up a lot of opportunities, and Power BI can support you in a full data analysis workflow. This course will teach you how to explore content created in Power BI by your teammates. You’ll also learn how to create your first graph.
Beginner
Get started today
Access this course and other top-rated tech content with one of our business plans.
Try this course for free
Access this course and other top-rated tech content with one of our individual plans.
This course is included in the libraries shown below:
- Data
What you'll learn
Power BI can empower you to uncover trends and patterns hidden within your data, enabling you to make data-driven decisions. In this course, Data Literacy: Essentials of Power BI, you’ll learn to consume and create charts using Power BI. First, you’ll discover the key features of Power BI. Next, you’ll explore interactive and paginated reports. Finally, you’ll learn how to build and share content with your colleagues. When you’re finished with this course, you’ll have the skills and knowledge to navigate and design Power BI reports.
Data Literacy: Essentials of Power BI
Beginner
Table of contents
As a data analyst enthusiast, Mihaela has special interests in translating vision into action using end-to-end data analysis while being very passionate about teaching.
