
- Course
Designing Charts with Sisense L2022
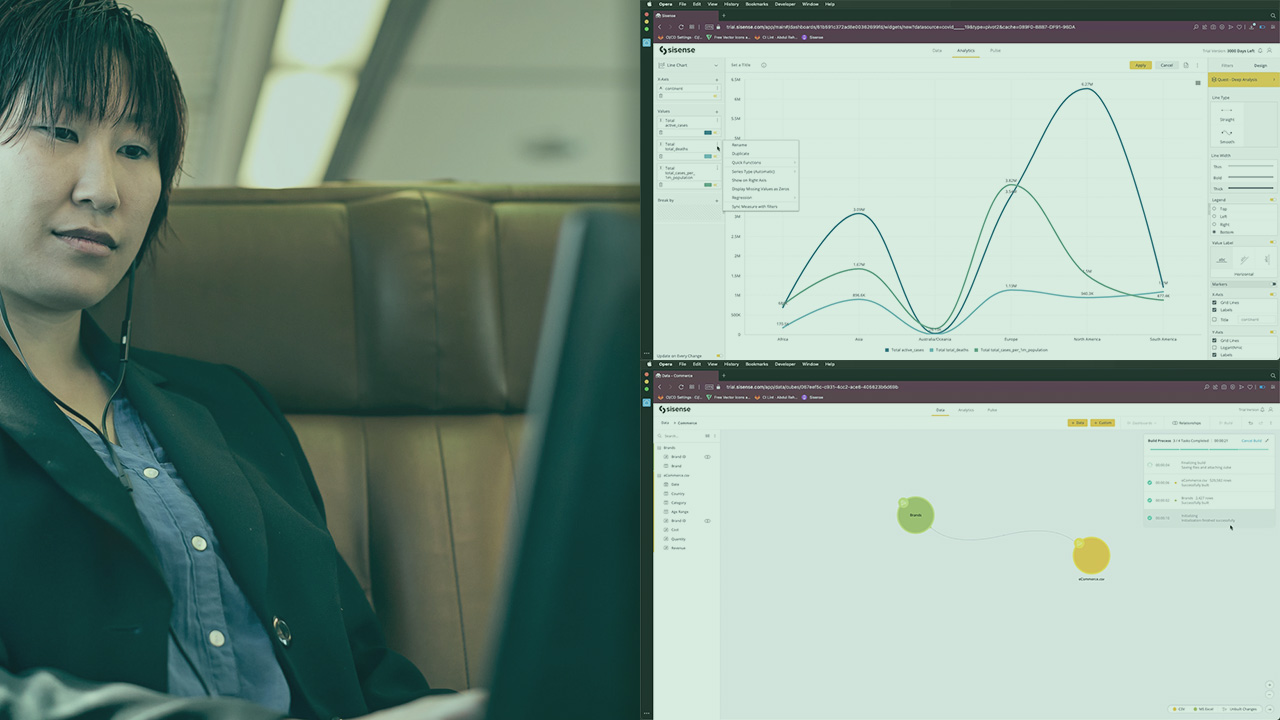
This course will teach you how to design different charts and add widgets in your dashboards using Sisense.
Beginner
- Course
Designing Charts with Sisense L2022
This course will teach you how to design different charts and add widgets in your dashboards using Sisense.
Beginner
Get started today
Access this course and other top-rated tech content with one of our business plans.
Try this course for free
Access this course and other top-rated tech content with one of our individual plans.
This course is included in the libraries shown below:
- Data
What you'll learn
Business intelligence and analytics have evolved over time, and in a world of growing data complexity, Sisense occupies a unique spot within the business intelligence (BI) landscape because it goes beyond business intelligence to market disruption with AI-driven technology that instantly infuses analytics everywhere. In this course, Designing Charts with Sisense L2022, you’ll learn to design different charts and add widgets using Sisense. First, you’ll explore the basics of the Sisense platform. Next, you’ll discover how to design mapping charts like scatter, area plots, and treemaps. Then, you will understand the Table and Text widget. Finally, you’ll learn how to add widgets into your dashboard. When you’re finished with this course, you’ll have the skills and knowledge of Sisense needed to build and design powerful analytics.
Designing Charts with Sisense L2022
Beginner
