
- Course
Force Layout Graphs in D3 5
This quick and informative course packed with hands-on demos using D3.js and SVG will teach you everything you need to know to visualize data with modern force layout graphs.
Intermediate
- Course
Force Layout Graphs in D3 5
This quick and informative course packed with hands-on demos using D3.js and SVG will teach you everything you need to know to visualize data with modern force layout graphs.
Intermediate
Get started today
Access this course and other top-rated tech content with one of our business plans.
Try this course for free
Access this course and other top-rated tech content with one of our individual plans.
This course is included in the libraries shown below:
- Data
What you'll learn
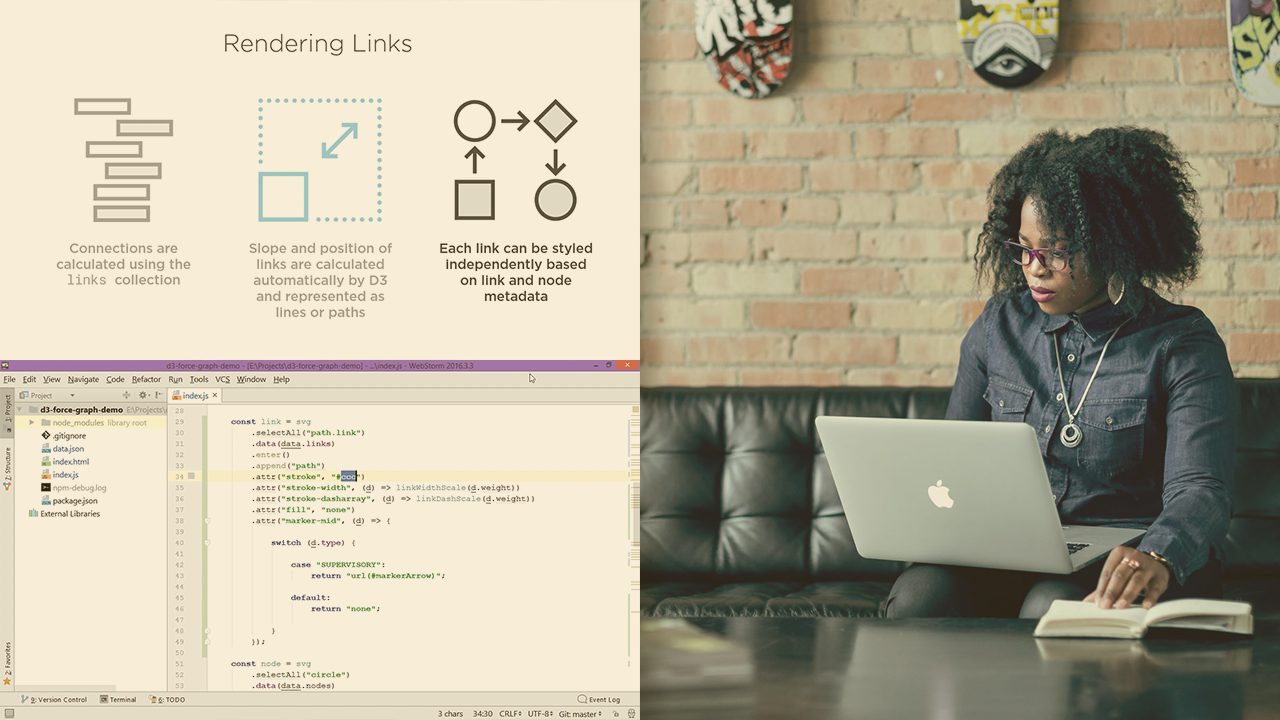
In this course, Force Layout Graphs in D3, you’ll gain the ability to visualize data from scratch using D3 and SVG. First, you’ll learn how to construct a force layout graph with Node.js, CSS and D3. Next, you’ll learn how to encode data into the graph by adding and styling shapes or images for each data point, and adding styled lines between them. Finally, you’ll explore how to customize the look of force layout graphs by tweaking the variables of gravity, charge, distance and strength. When you’re finished this course, you’ll have the skills and knowledge of D3.js needed to independently graph data in at least one format and facilitate executive conclusions about data. Software required: Text editor (WebStorm or Sublime recommended), Node.js (optional).
Force Layout Graphs in D3 5
Intermediate
Table of contents
-
Version Check | 20s
-
Introduction | 1m 37s
-
Understanding Force Layout Graphs | 1m 48s
-
Finished App Preview | 2m 48s
-
Force Layout Graph Structure | 2m 51s
-
Demo: Setting up the Coding Environment | 4m 48s
-
Pulling in External Data | 1m 33s
-
Demo: Pulling in External Data | 4m 35s
-
Creating a Simple Force Graph | 58s
-
Demo: Creating a Simple Force Graph | 11m 23s
-
Module Summary | 1m
Daniel Stern is a freelance web developer from Toronto, Ontario who specializes in Angular, ES6, TypeScript and React. His work has been featured in CSS Weekly, JavaScript Weekly and at Full Stack Conf in England.
