
- Course
Perform Basic Statistical Analysis in Microsoft Excel
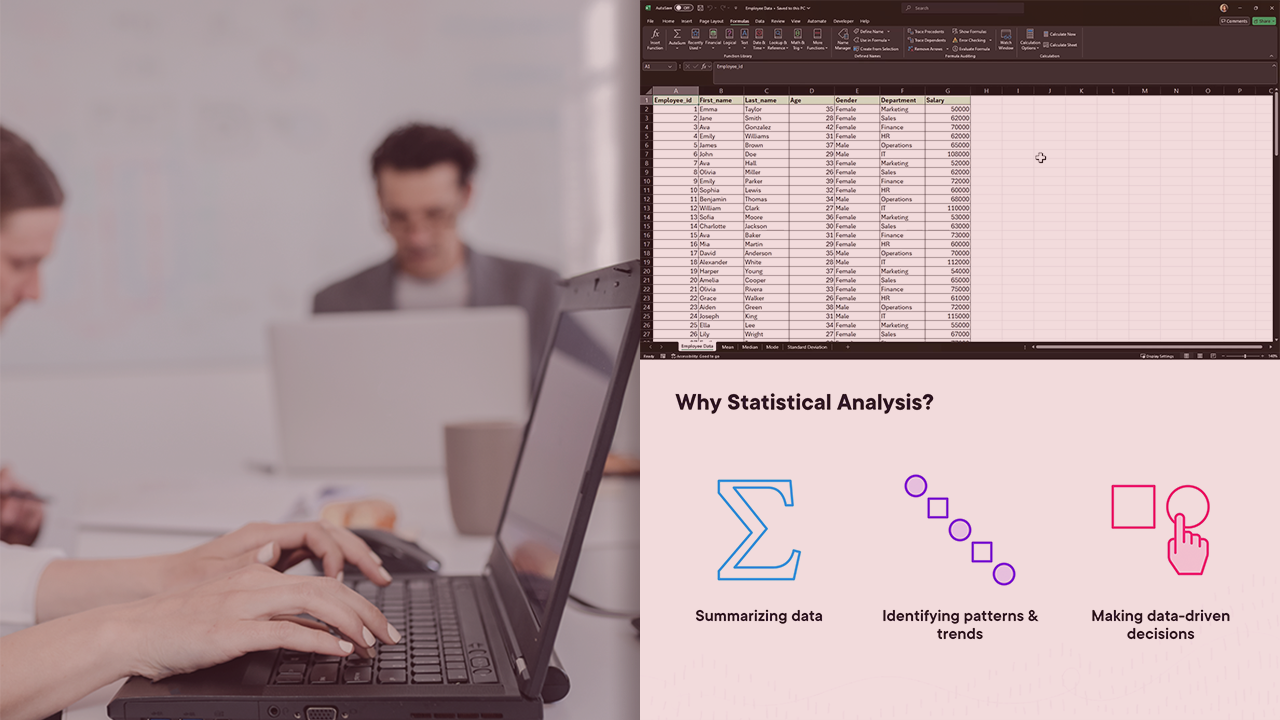
Learn the essentials of statistical analysis in Microsoft Excel. This course will teach you how to calculate the mean, median, mode, and standard deviation using Excel functions, enabling you to analyze and interpret data effectively.
Intermediate
- Course
Perform Basic Statistical Analysis in Microsoft Excel
Learn the essentials of statistical analysis in Microsoft Excel. This course will teach you how to calculate the mean, median, mode, and standard deviation using Excel functions, enabling you to analyze and interpret data effectively.
Intermediate
Get started today
Access this course and other top-rated tech content with one of our business plans.
Try this course for free
Access this course and other top-rated tech content with one of our individual plans.
This course is included in the libraries shown below:
- Data
What you'll learn
Understanding basic statistical analysis is crucial for interpreting data effectively.
In this course, Perform Basic Statistical Analysis in Microsoft Excel, you'll learn how to calculate mean, median, mode, and standard deviation using Excel functions. You'll explore new functions like MODE.MULT, MODE.SNGL, and STDEV.S to enhance your data analysis skills.
When you’re finished with this course, you’ll have a better understanding of how to use Excel to perform fundamental statistical analysis, enabling you to analyze and interpret data to gain meaningful insights.
Perform Basic Statistical Analysis in Microsoft Excel
Intermediate
Table of contents
Amruta is a data Analyst & Excel VBA ninja who's worked with market leaders in Finance & Consumer Goods. She is passionate about sharing her gift for data manipulation and visualization.
