
- Course
Power Platform Foundations: Introduction to Power BI
This course will teach you how to use Power BI to create charts, reports, and dashboards.
Beginner
- Course
Power Platform Foundations: Introduction to Power BI
This course will teach you how to use Power BI to create charts, reports, and dashboards.
Beginner
Get started today
Access this course and other top-rated tech content with one of our business plans.
Try this course for free
Access this course and other top-rated tech content with one of our individual plans.
This course is included in the libraries shown below:
- Core Tech
What you'll learn
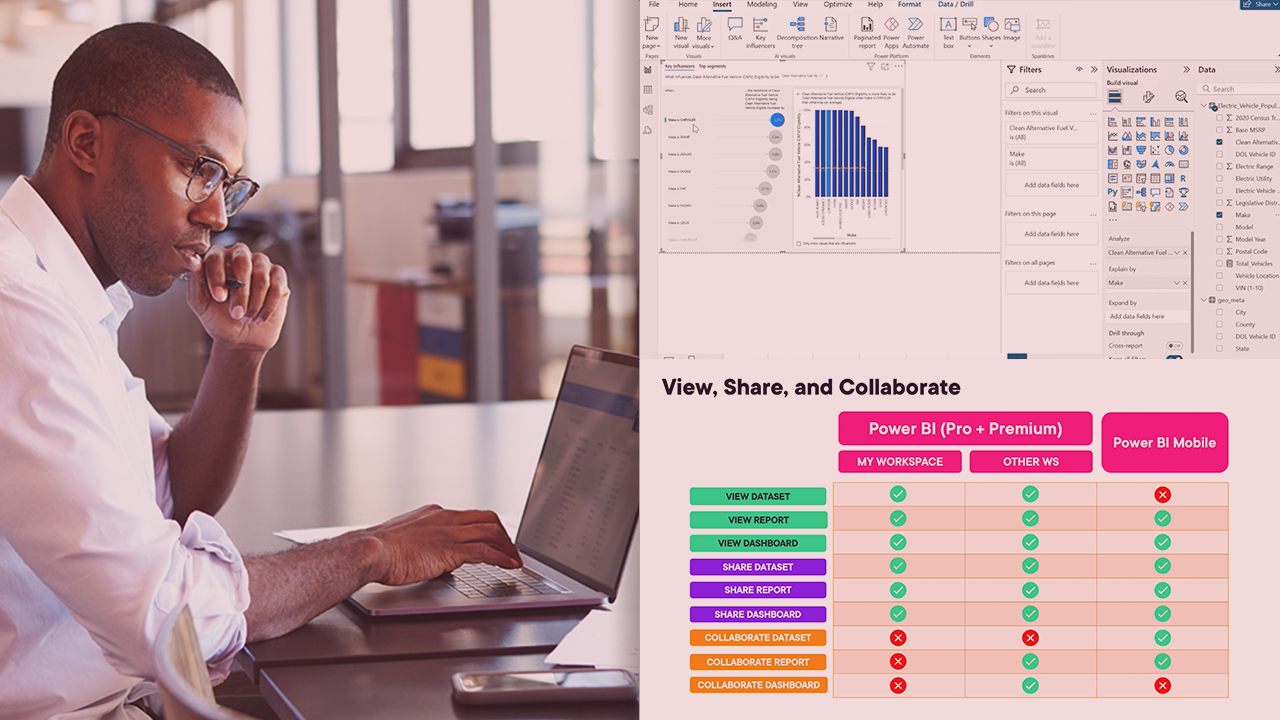
Knowing how to fully utilize the essential components of Power BI is a valuable skill to add to your data visualization toolbox. In this course, Power Platform Foundations: Introduction to Power BI, you’ll learn how to use Power BI to create charts, reports, and dashboards and derive insights from data. First, you’ll explore key components of the Power BI Dashboard. Next, you’ll discover how to leverage Power BI to create beautiful graphs, dashboards, and reports. Finally, you’ll learn how to use the Power BI service and mobile app to share reports with multiple users and teams. When you’re finished with this course, you’ll have the skills and knowledge of the Power BI tool needed to create beautiful charts.
Power Platform Foundations: Introduction to Power BI
Beginner
Table of contents
Ranjan Relan is a Data and Tech Strategy Consultant with 11+ years of experience in the field of Machine Learning, Big Data, Cloud Computing and Data warehousing.
