
- Course
Building Charts and Visualizations in Qlik Sense
Discover several techniques used to build charts and visualizations in Qlik, ranging from relatively simple chart types and properties to very complex applications that link charts to expressions and utilize master measures and dimensions.
Beginner
Get started today
Access this course and other top-rated tech content with one of our business plans.
Try this course for free
Access this course and other top-rated tech content with one of our individual plans.
This course is included in the libraries shown below:
- Data
What you'll learn
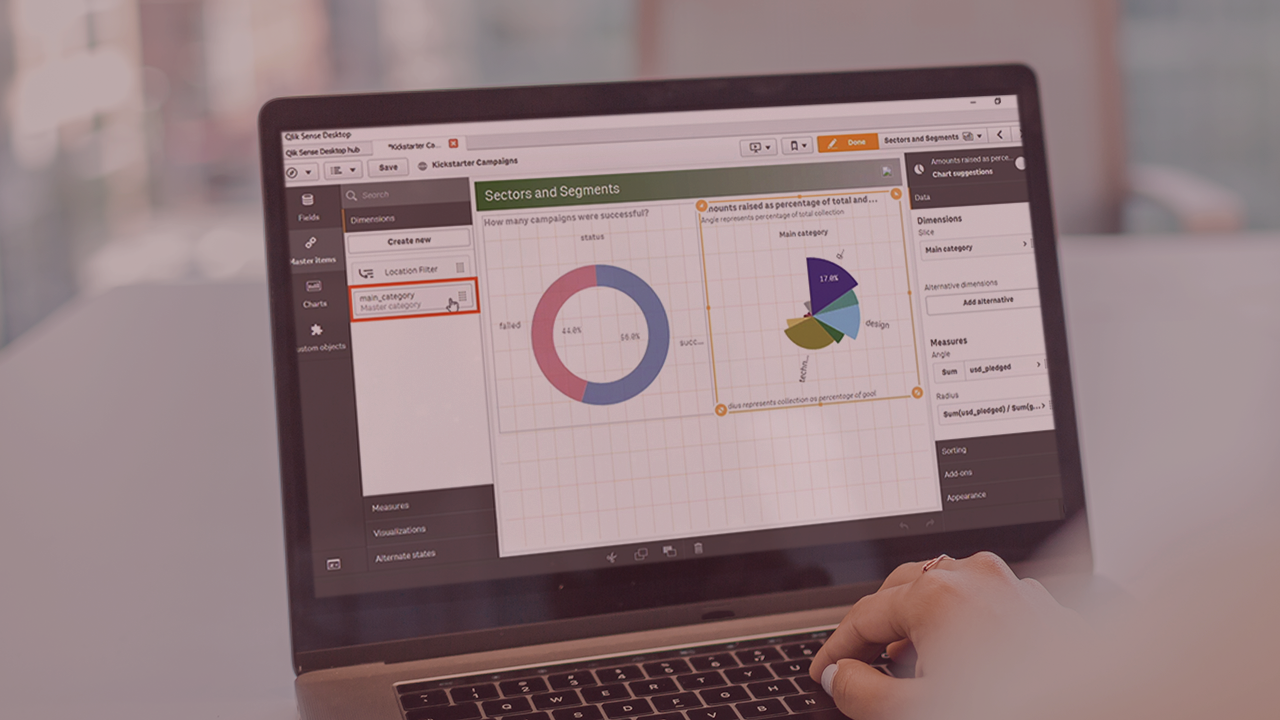
Qlik Sense is fast emerging as a popular choice for building sophisticated visualizations of complex data for an executive-level audience. In this course, Building Charts and Visualizations in Qlik Sense, you will gain the ability to construct and render complex analytics, and display those analytics using powerful built-in tools. First, you will learn how to create and maintain sheets, which are the basic building blocks of Qlik applications. Next, you will discover how to apply themes and styling options to sheets. Finally, you will round out the course by working with different Qlik constructs such as master dimensions, master measures, and master visualizations. When you’re finished with this course, you will have the skills and knowledge to build complex charts and visualizations that get across insights from data in a sophisticated and compelling manner.
Building Charts and Visualizations in Qlik Sense
Beginner
Table of contents
-
Version Check | 11s
-
Module Overview | 1m 9s
-
Prerequisites and Course Outline | 1m 47s
-
Introducing Qlik | 3m 17s
-
Exploring the Qlik Sense Desktop | 5m 32s
-
Creating and Loading Data into an App | 6m 2s
-
Generating Insights to Add Charts to Sheets | 2m 47s
-
Customizing the App | 4m 24s
-
Opening an App with No Data | 5m 27s
-
Customizing Sheets | 6m 10s
-
Summary | 52s
A problem solver at heart, Janani has a Masters degree from Stanford and worked for 7+ years at Google. She was one of the original engineers on Google Docs and holds 4 patents for its real-time collaborative editing framework.
