
- Course
Data Visualization with ggplot2 in R
Visualizations give context, understanding, and weight to the insight gained from data analysis. This course will teach you how to produce professional and informative data visualizations in R using ggplot2.
Beginner
- Course
Data Visualization with ggplot2 in R
Visualizations give context, understanding, and weight to the insight gained from data analysis. This course will teach you how to produce professional and informative data visualizations in R using ggplot2.
Beginner
Get started today
Access this course and other top-rated tech content with one of our business plans.
Try this course for free
Access this course and other top-rated tech content with one of our individual plans.
This course is included in the libraries shown below:
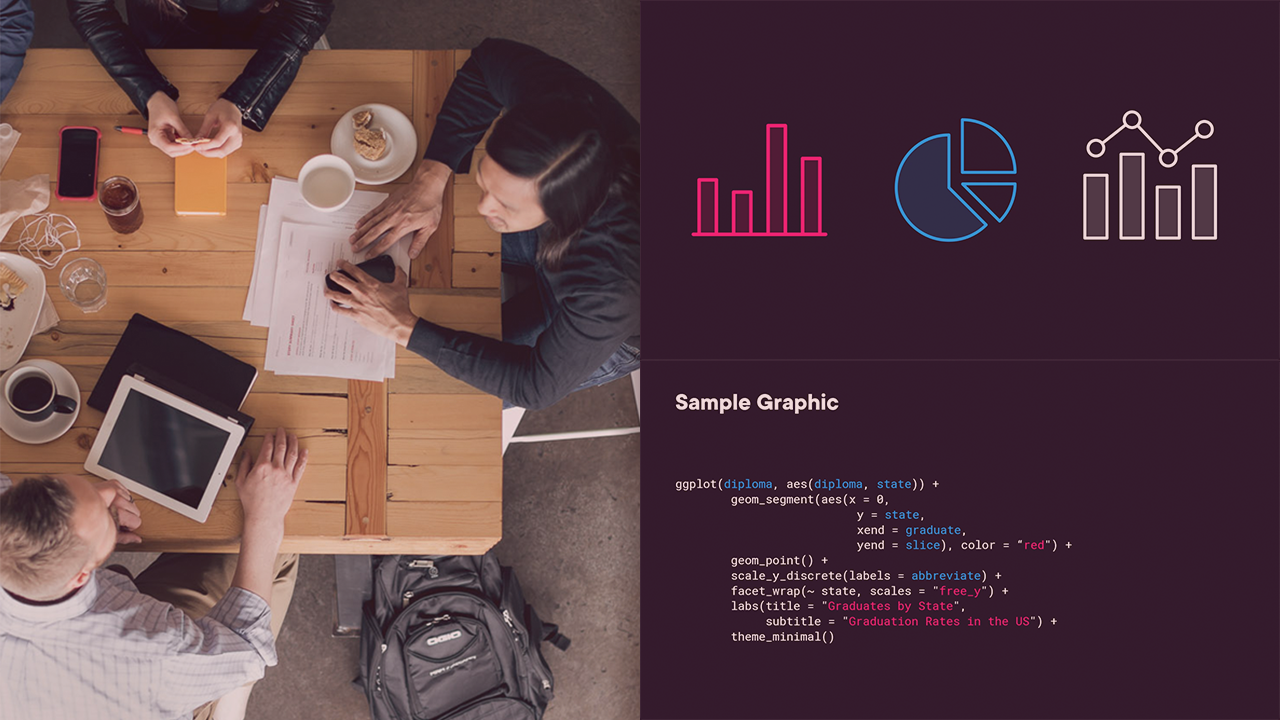
- Data
What you'll learn
The R programming language is a powerful tool to make sense of data. Often, however, a graphical representation of scale, depth, and contrast is required to truly understand and communicate the findings of data analysis.
In this course, Data Visualization with ggplot2 in R, you’ll gain the ability to create professional and informative data visualizations in your R projects and publications.
First, you’ll explore ggplot basics using provided sample data sets to produce bar graphs, line charts, and histograms. Next, you’ll discover how to customize the appearance of your charts with colors, labels, and titles, as well as choosing the appropriate scale and axes for each specific data set's characteristics. Then, you'll apply these concepts to increasingly complex visualizations such as facet grids and scatter plots. Finally, you’ll learn how to publish and share your results through various formats, exports, notebooks, and more, including more advanced notations and design considerations. When you’re finished with this course, you’ll have the skills and knowledge of ggplot2 needed to comfortably visualize data in R.
Data Visualization with ggplot2 in R
Beginner
Table of contents
Currently an IT leader in Denver Colorado's financial sector Russ has focused on database development, modelling, administration, and BI since 1997 across the Microsoft stack. Russ is a passionate trainer and SQL community volunteer presenting regularly at PASS SQL Saturday events and local user groups around the US.
