
- Course
Creating and Stylizing Statistical Information in Illustrator
In this series of tutorials, we will be using graphs and charts to visualize data and learn how we can customize them to make them more appealing. Software required: Illustrator CC 2015.
Beginner
- Course
Creating and Stylizing Statistical Information in Illustrator
In this series of tutorials, we will be using graphs and charts to visualize data and learn how we can customize them to make them more appealing. Software required: Illustrator CC 2015.
Beginner
Get started today
Access this course and other top-rated tech content with one of our business plans.
Try this course for free
Access this course and other top-rated tech content with one of our individual plans.
This course is included in the libraries shown below:
- Core Tech
What you'll learn
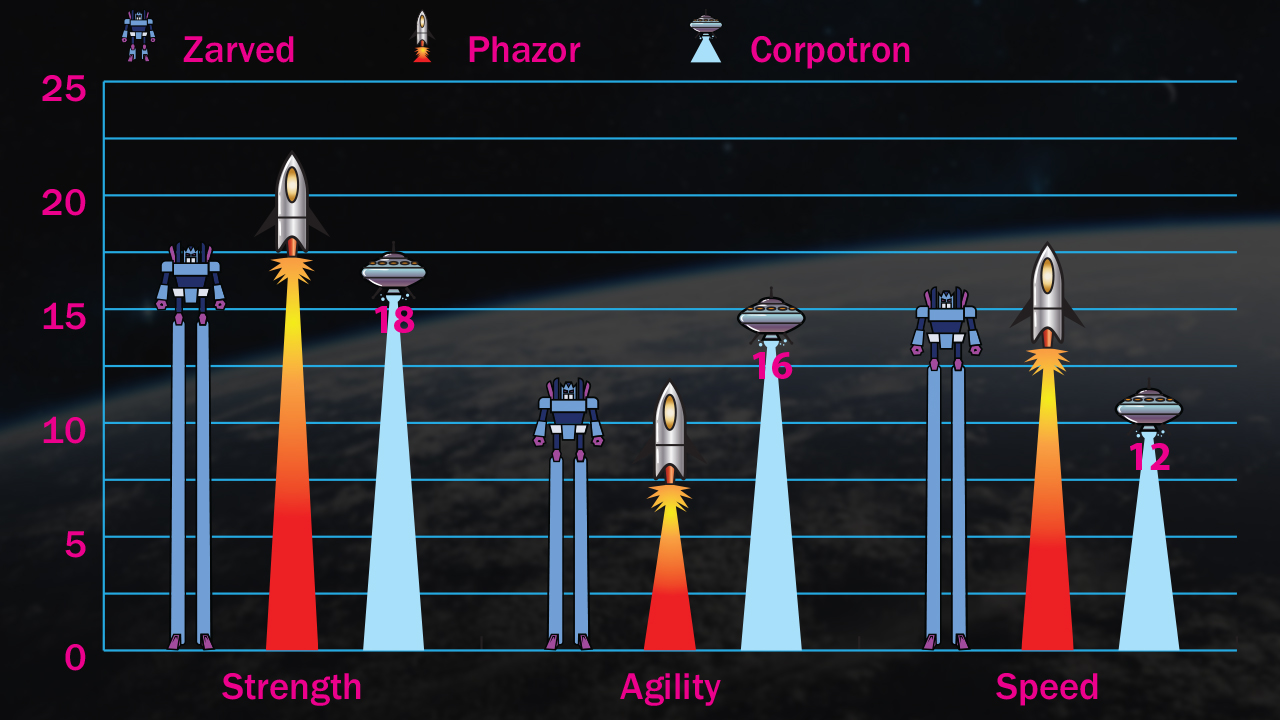
In this series of tutorials, we will be using graphs and charts to visualize data and learn how we can customize them to make them more appealing. We will start by getting familiar with the pie graph and how we can enter data to the worksheet to see results in our graph. We'll then move on to column and area graphs and learn what a data set is and how it is translated to our graphs. Next, we'll learn the importance of legends and labels and how we can get them to look intentional. We'll also combine different graph types in the same visualization and learn how we can format color and type for our graph. We'll finish by learning how we can use graphics in place of columns and markers in our graphs and also how we can customize the appearance of our graphics to get the best result. This course will teach you how to use many different graph types in Illustrator and by the end of this course you'll be more comfortable adding graphs to your report or data visualization and will have a solid understanding of how you can customize them to match your design. Software required: Illustrator CC 2015.
Creating and Stylizing Statistical Information in Illustrator
Beginner
Table of contents
