
- Course
Build Advanced Charts in Tableau Desktop
Learn to craft advanced, interactive charts in Tableau Desktop. This course will teach you how to create interactive visualizations, multi-metric comparisons, and insightful trends that uncover valuable patterns in your data.
Intermediate
- Course
Build Advanced Charts in Tableau Desktop
Learn to craft advanced, interactive charts in Tableau Desktop. This course will teach you how to create interactive visualizations, multi-metric comparisons, and insightful trends that uncover valuable patterns in your data.
Intermediate
Get started today
Access this course and other top-rated tech content with one of our business plans.
Try this course for free
Access this course and other top-rated tech content with one of our individual plans.
This course is included in the libraries shown below:
- Data
What you'll learn
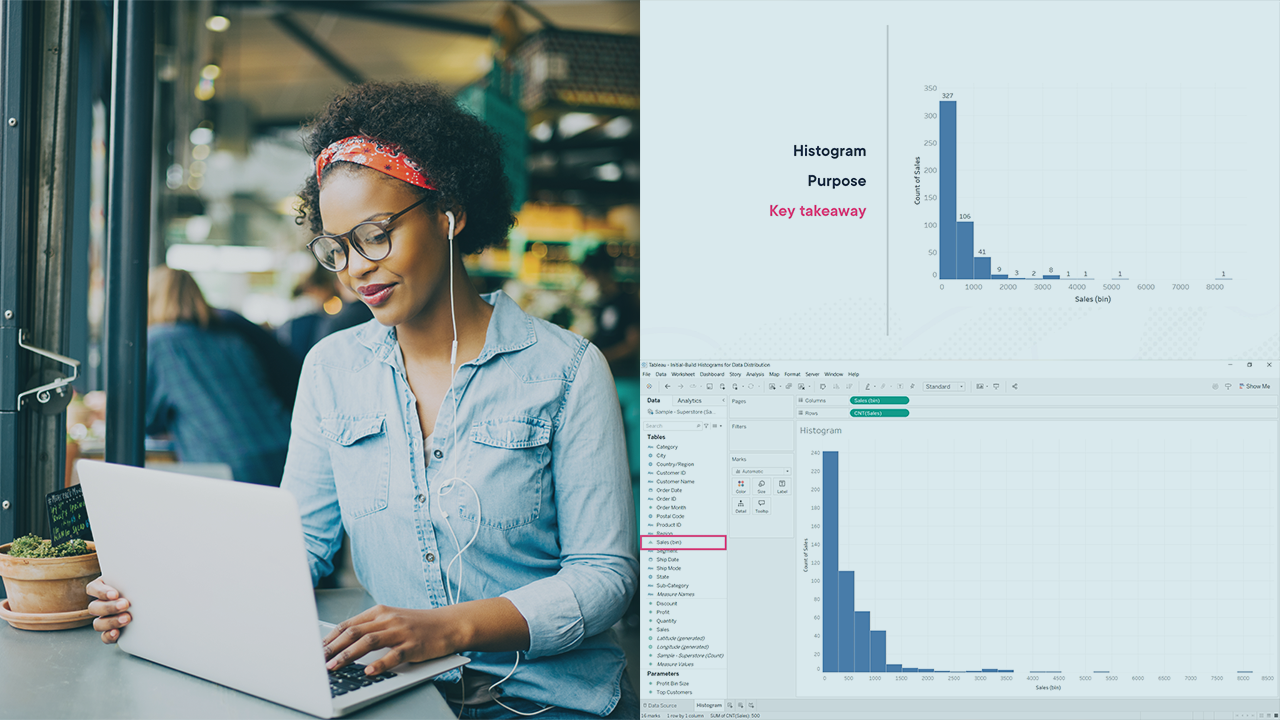
Building insightful dashboards often requires moving beyond basic charts to more advanced, customized visualizations that highlight trends, comparisons, and patterns effectively. In this course, Build Advanced Charts in Tableau Desktop, you’ll gain the ability to create expressive, interactive, and data-rich visualizations that bring clarity to your analysis. First, you’ll explore how to build charts for analyzing data distributions and relationships, such as histograms, box plots, and scatter plots with context-enhancing elements like trend lines and mark adjustments. Next, you’ll discover how to construct multi-dimensional and multi-metric charts - such as dual-axis views, bullet graphs, and combo charts - that present layered insights in a single view. Finally, you’ll learn how to create advanced categorical visualizations and customize charts with logic, parameters, and interactivity, including dynamic reference lines, calculated annotations, and contextual drill-downs using Viz in Tooltip. When you’re finished with this course, you’ll have the skills and knowledge of advanced Tableau Desktop visualizations needed to build impactful, interactive charts that convey deeper data stories.
Build Advanced Charts in Tableau Desktop
Intermediate
Table of contents
Avdhesh Gaur is a Data Analyst, instructor, author, mentor, storyteller, speaker, and consultant as well when it comes to bringing insights out of data and presenting the story behind. His career spans more than 6 years with a focus on building Data-driven BI models using Tableau & numerous other statistical data analysis Techniques.
