
- Course
Visualizing Data with PivotCharts
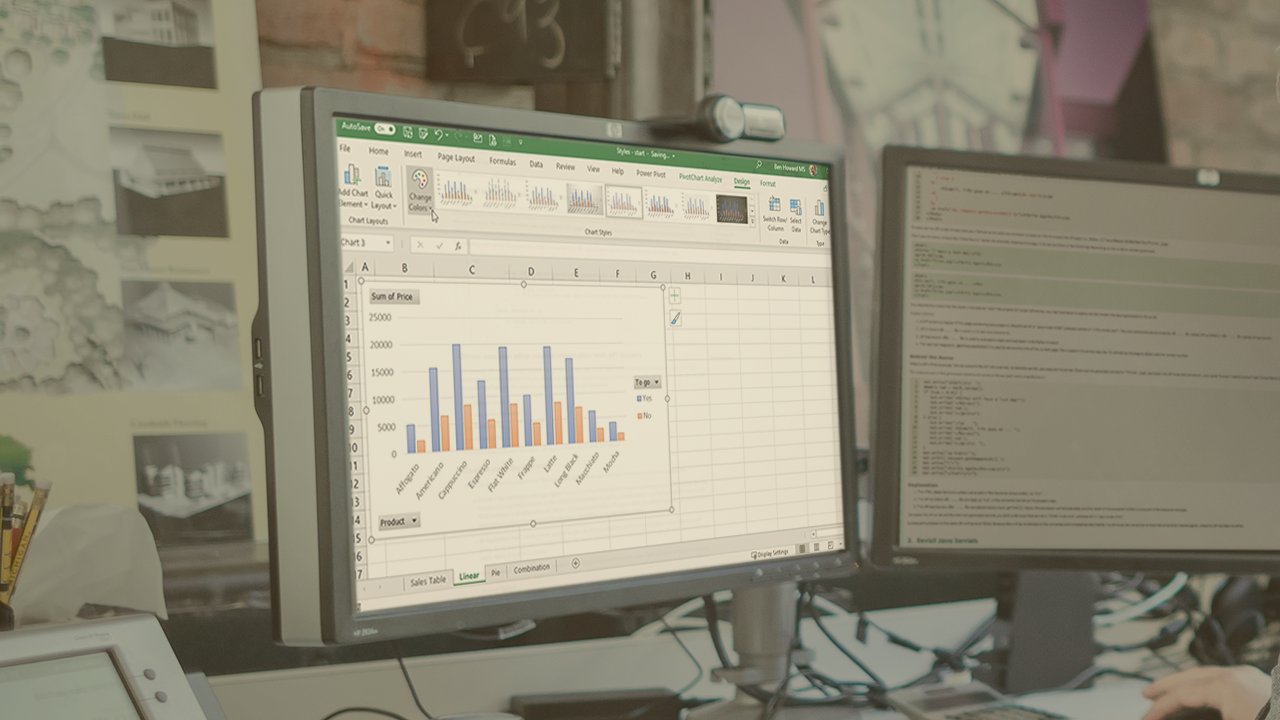
This course explores Excel PivotCharts that display a visual representation of PivotTables. The course shows you how to choose a PivotChart, select the data to visualize and modify the look and feel of the chart to meet your requirements.
Beginner
- Course
Visualizing Data with PivotCharts
This course explores Excel PivotCharts that display a visual representation of PivotTables. The course shows you how to choose a PivotChart, select the data to visualize and modify the look and feel of the chart to meet your requirements.
Beginner
Get started today
Access this course and other top-rated tech content with one of our business plans.
Try this course for free
Access this course and other top-rated tech content with one of our individual plans.
This course is included in the libraries shown below:
- Data
What you'll learn
A picture is worth a thousand words, and PivotCharts are no exception, providing a neat way of visualizing the data from a corresponding PivotTable. In this course, Visualizing Data with PivotCharts, you will gain the skills to quickly produce charts to a professional standard, which neatly summarize the associated PivotTable, allowing you to visualize the data and spot any trends within it. First, you will learn what PivotCharts are and the different types of charts available for you to use. Next, you will discover how to create PivotCharts, choose the correct chart type, and finesse the look and feel of the chart. Finally, you will explore how to make the chart truly interactive by adding filters, slicers, and drill-up/drill-down capability, helping you answer all those difficult data-related questions that your coworkers and managers just keep on asking! When you are finished this course, you will have the skills and knowledge to use Excel PivotCharts in order to professionally present your data.
Visualizing Data with PivotCharts
Beginner
Ben is a Power BI & Data Specialist with a healthy interest in Microsoft Project with over 30 years of customer and implementation experience. He has been a Microsoft MVP for 13 years, is a frequent speaker at several European conferences, and blogs and creates videos on a semi-regular basis.
