- Course
Build Your First Data Visualization with MicroStrategy
Vision, out of all our senses, is the most powerful channel for receiving information. This course will teach you how to bring data to life using MicroStrategy.

- Course
Build Your First Data Visualization with MicroStrategy
Vision, out of all our senses, is the most powerful channel for receiving information. This course will teach you how to bring data to life using MicroStrategy.
Get started today
Access this course and other top-rated tech content with one of our business plans.
Try this course for free
Access this course and other top-rated tech content with one of our individual plans.
This course is included in the libraries shown below:
- Data
What you'll learn
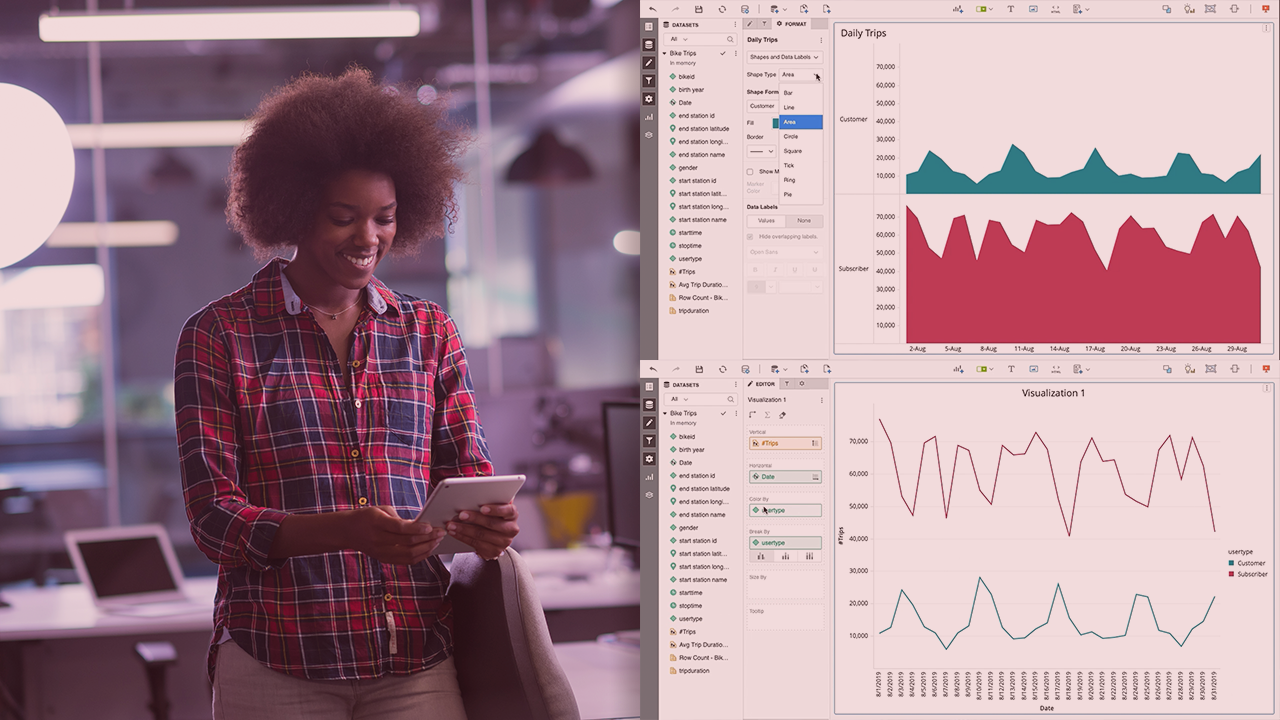
A data visualization communicates messages hidden in data more efficiently than any other communication forms. In this course, Build Your First Data Visualization with MicroStrategy, you’ll learn to create and format various chart types. First, you’ll explore MicroStrategy’s interface. Next, you’ll discover how to connect to a data source for analysis. Finally, you’ll learn how to build graphs and apply filters. When you’re finished with this course, you’ll have the skills required for crafting data visualizations with MicroStrategy.

