- Course
Build Your First Data Visualization with amCharts 4
Understanding your data is key to building a successful business. This course will teach you how to effectively visualize your data using amCharts by integrating XY and Pie charts in your applications.

- Course
Build Your First Data Visualization with amCharts 4
Understanding your data is key to building a successful business. This course will teach you how to effectively visualize your data using amCharts by integrating XY and Pie charts in your applications.
Get started today
Access this course and other top-rated tech content with one of our business plans.
Try this course for free
Access this course and other top-rated tech content with one of our individual plans.
This course is included in the libraries shown below:
- Data
What you'll learn
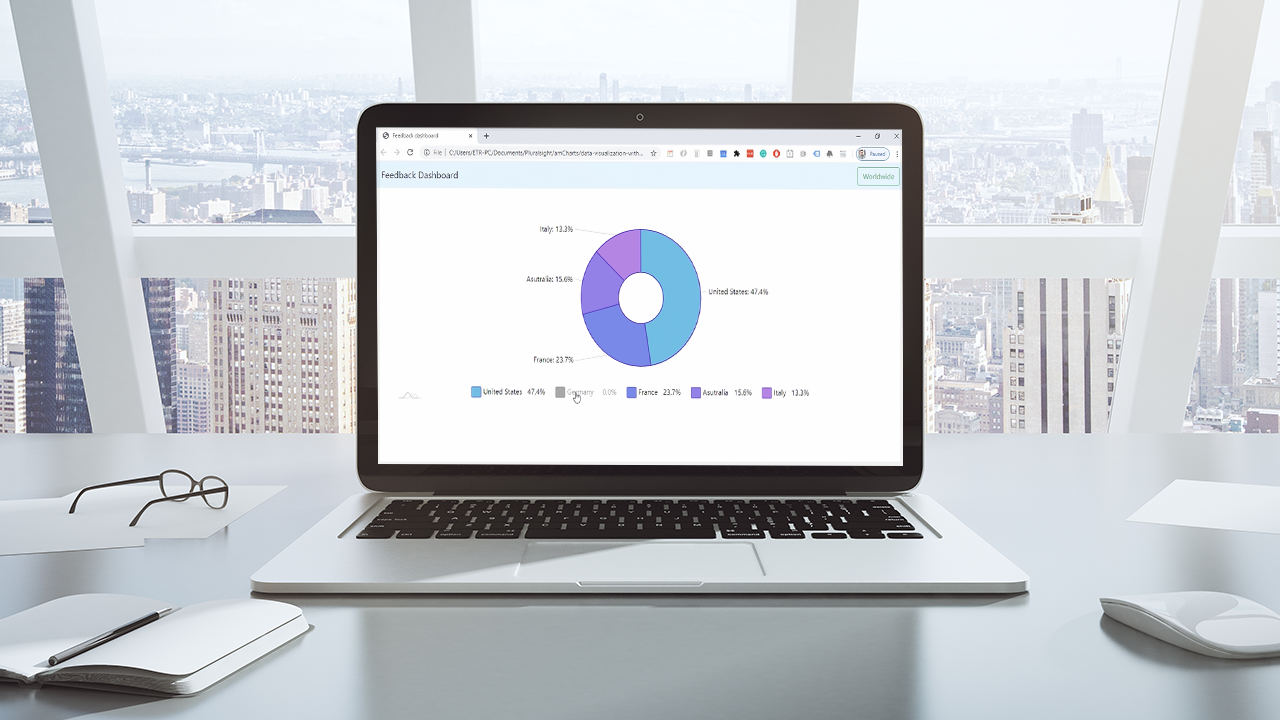
Having a lot of data, but not being able to read/understand them is no different than not having them at all. In this course, Build Your First Data Visualization with amCharts, you’ll learn to better understand your data by integrating charts into your web applications. First, you’ll explore what is amCharts and how to set it up in a web Application. Next, you’ll discover how to use amCharts to generate a line/XY chart and a pie chart to work with data. Finally, you’ll learn how to customize a chart’s style. When you’re finished with this course, you’ll have the skills and knowledge of amCharts library needed to build a highly efficient and interactive chart to get a better insight into your data.

