
- Course
Data Show and Tell: Exploring NVIDIA Finance Data with Python Shiny
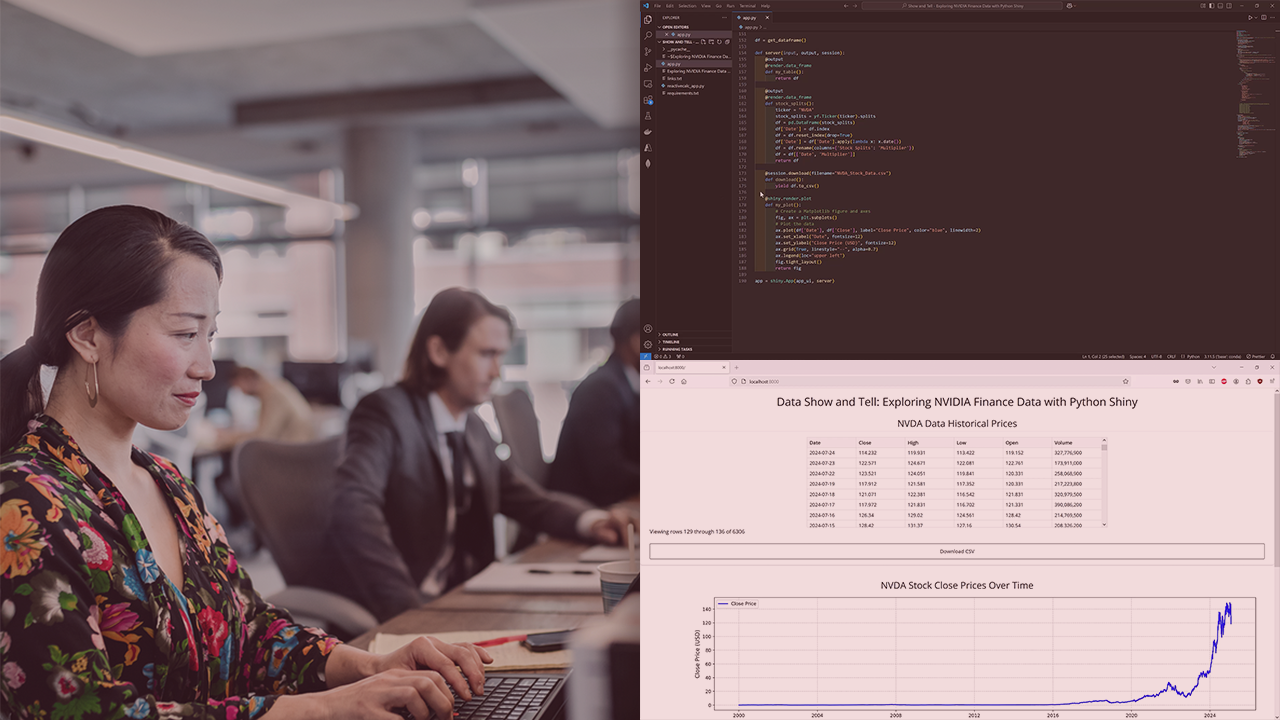
Python Shiny is a dynamic application development framework used for interactive data visualization and Python code execution. In this course, you'll learn how to collect financial data and display it with Python Shiny.
Advanced
- Course
Data Show and Tell: Exploring NVIDIA Finance Data with Python Shiny
Python Shiny is a dynamic application development framework used for interactive data visualization and Python code execution. In this course, you'll learn how to collect financial data and display it with Python Shiny.
Advanced
Get started today
Access this course and other top-rated tech content with one of our business plans.
Try this course for free
Access this course and other top-rated tech content with one of our individual plans.
This course is included in the libraries shown below:
- Data
What you'll learn
Complete a hands-on project analyzing NVIDIA’s stock performance to teach you how to collect, process, and visualize financial data using Python Shiny. Python Shiny is a powerful framework for building interactive web applications that combines dynamic data visualization with Python's analytical capabilities.
In this course, Data Show and Tell: Exploring NVIDIA Finance Data with Python Shiny, you’ll learn how to retrieve NVIDIA’s financial data from sources like Yahoo Finance or Finnhub, clean and preprocess it, and analyze key metrics such as historical stock prices and trading volumes.
You'll discover how to build an interactive dashboard that displays trends, allows custom inputs like date ranges, and provides a user-friendly interface for exploring stock data.
By the end of this course, you’ll have a functional Python Shiny application and valuable skills for creating interactive, data-driven projects in finance and beyond.
Data Show and Tell: Exploring NVIDIA Finance Data with Python Shiny
Advanced
Table of contents
Ian is a database enthusiast with particular expertise in the Microsoft data stack. Other technologies that Ian has expert level experience with include ETL, Python development, cloud architecture and systems automation. Ian holds the Microsoft Certified Solutions Expert (MCSE) for data management and analytics as well as the AWS Solution Architect associate certifications. Ian also writes for multiple technical blogs including SuperFunSQL.com which he founded in 2019.
