- Course
Excel 2019 Pro
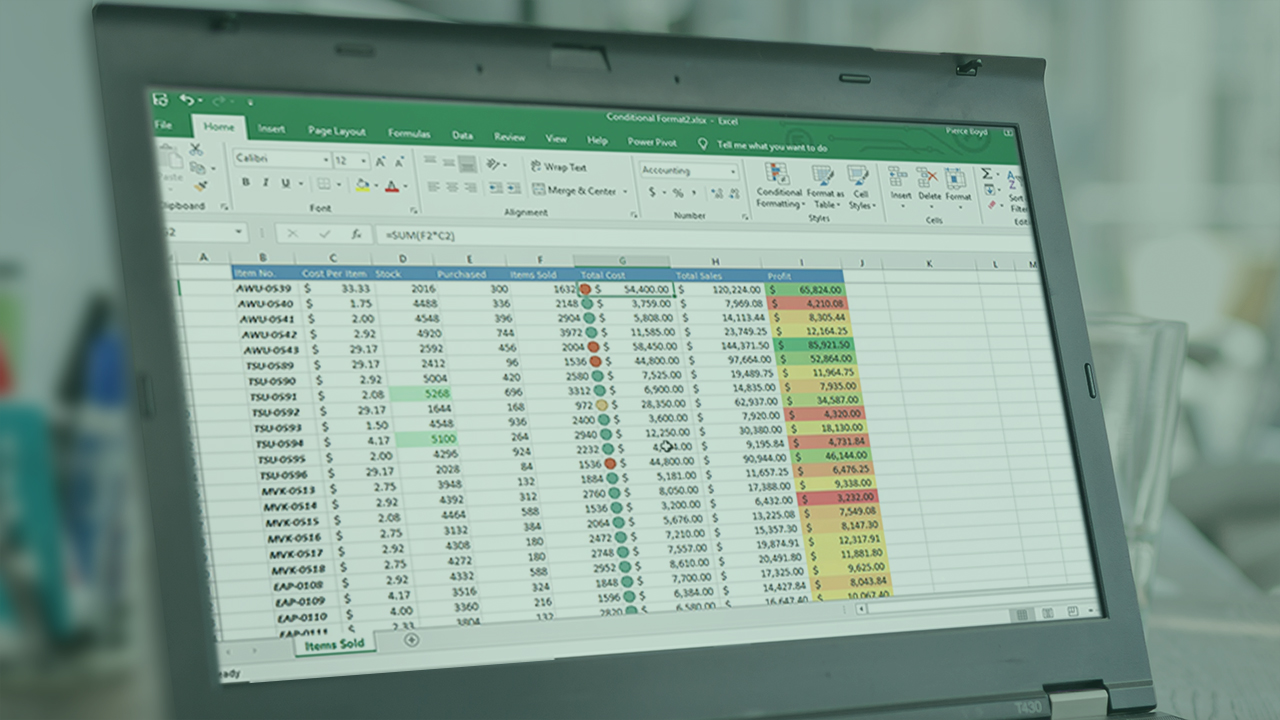
In this course, you’ll learn the most advanced aspects of working with Excel 2019. Explore how to perform all sorts of useful functions, pivot tables, macros, form controls, and much more in this massive deep dive into the world of Excel 2019.

- Course
Excel 2019 Pro
In this course, you’ll learn the most advanced aspects of working with Excel 2019. Explore how to perform all sorts of useful functions, pivot tables, macros, form controls, and much more in this massive deep dive into the world of Excel 2019.
Get started today
Access this course and other top-rated tech content with one of our business plans.
Try this course for free
Access this course and other top-rated tech content with one of our individual plans.
This course is included in the libraries shown below:
- Core Tech
What you'll learn
Learn the most advanced aspects of Excel 2019. In this course, Excel 2019 Pro, you'll take your knowledge to the ultimate level. First, you'll learn how to format and work with data. Then, you’ll learn about queries, text/logical/statistical and other functions. Finally, you’ll learn conditional formatting, charts, pivot tables, macros, and form controls. When you’re finished with this course, you'll have the skills and knowledge of Excel 2019 needed to format and work with more advanced spreadsheets (and continue your preparation for the Microsoft Office exams).

