- Course
Reporting Services Report Development Fundamentals -Part 2
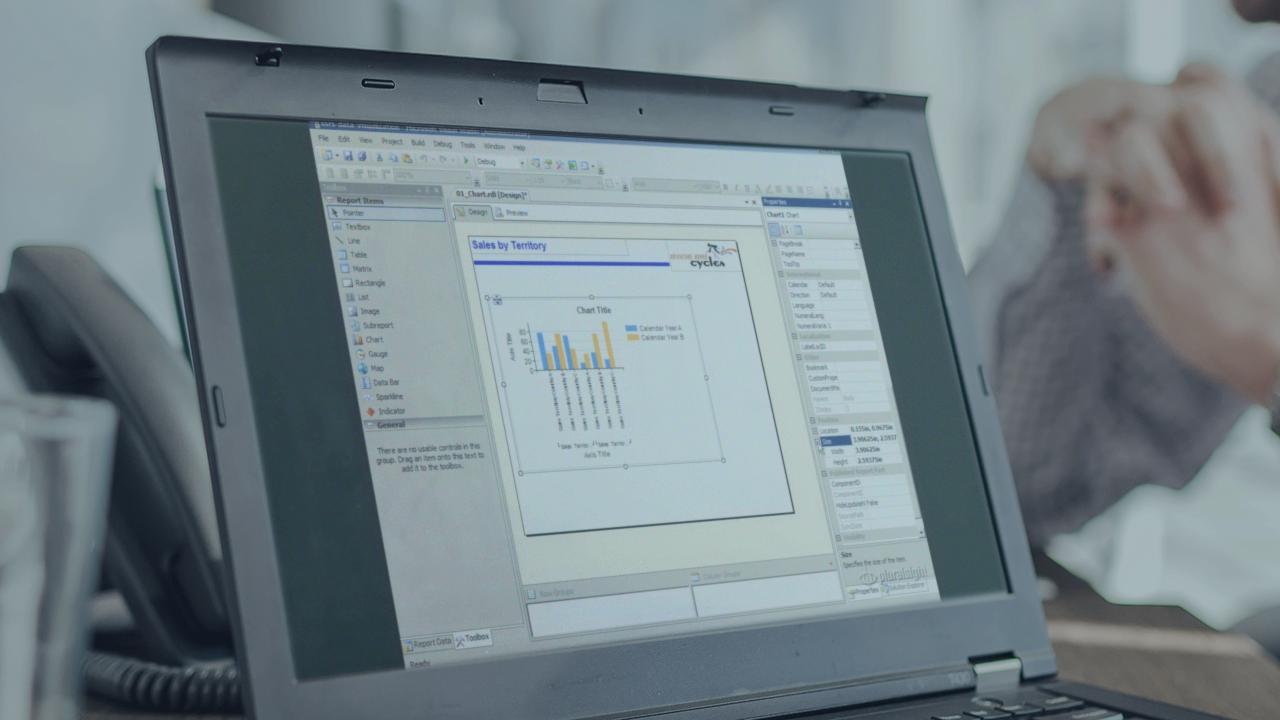
This course is for report developers new to Reporting Services and explains how to work with charts, maps, pagination, and interactive features

- Course
Reporting Services Report Development Fundamentals -Part 2
This course is for report developers new to Reporting Services and explains how to work with charts, maps, pagination, and interactive features
Get started today
Access this course and other top-rated tech content with one of our business plans.
Try this course for free
Access this course and other top-rated tech content with one of our individual plans.
This course is included in the libraries shown below:
- Data
What you'll learn
This course continues building on the foundation established in the Reporting Services Fundamentals course. It explains how to work with all of the data visualization features in the SQL Server 2008 R2 release of Reporting Services, including charts, data bars, sparklines, gauges, and maps. It also explains features for pagination in print-ready reports and for interactivity in online reports.

