
- Course
Analyzing and Visualizing Data with Power BI (PL-100)
This course will teach you all the skills required for the analyze and visualize data section of the PL100 Microsoft Power Platform App Maker course and exam.
Beginner
- Course
Analyzing and Visualizing Data with Power BI (PL-100)
This course will teach you all the skills required for the analyze and visualize data section of the PL100 Microsoft Power Platform App Maker course and exam.
Beginner
Get started today
Access this course and other top-rated tech content with one of our business plans.
Try this course for free
Access this course and other top-rated tech content with one of our individual plans.
This course is included in the libraries shown below:
- Core Tech
What you'll learn
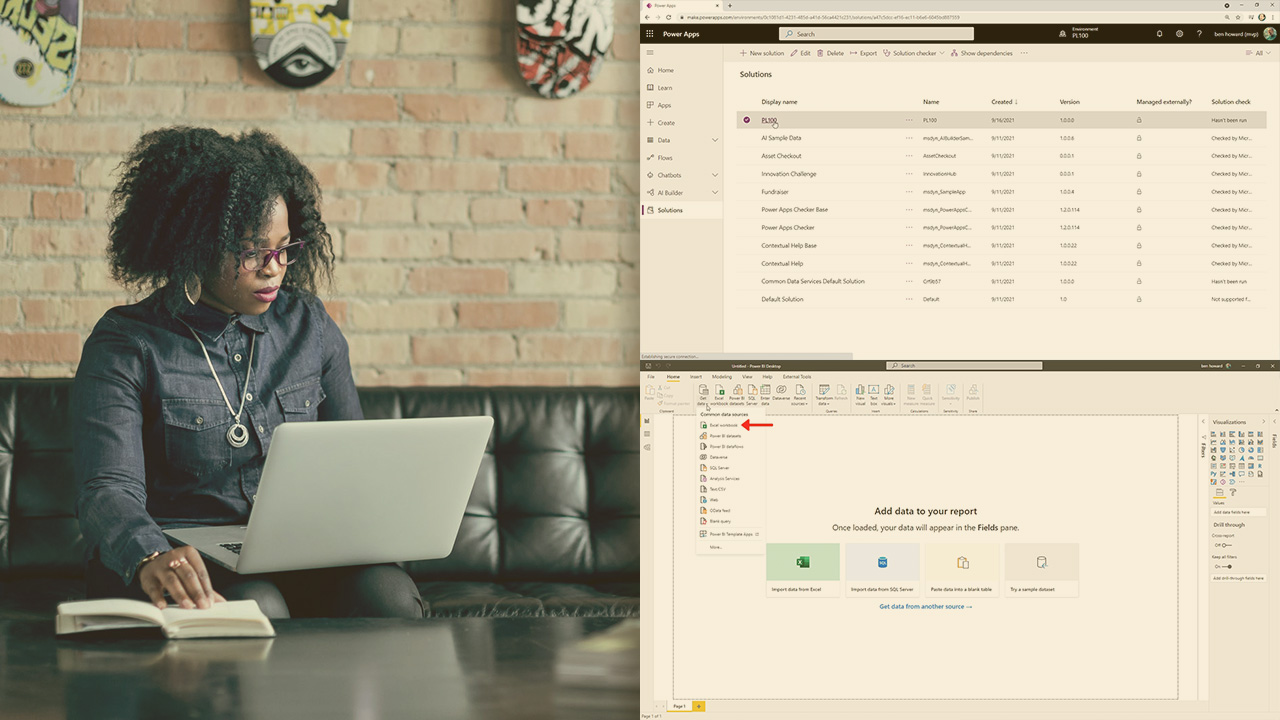
Being able to analyze and visualize data is crucial to the PL100 Microsoft Power Platform App Maker exam. In this course, Analyzing and Visualizing Data with Power BI (PL-100), you’ll learn to visualize data in Power BI and Power Apps. First, you’ll explore how to create Power BI reports and dashboards using the Power BI desktop and Power BI service. Next, you’ll discover how to embed canvas apps into Power BI reports and dashboards. Finally, you’ll learn how to embed Power BI reports and dashboards into both Canvas apps and Model driven apps. When you’re finished with this course, you’ll have the skills and knowledge of Power BI and Power Apps needed to successfully complete the Analyzing and Visualizing Data with Power BI section of the Microsoft Power Platform App Maker exam.
Analyzing and Visualizing Data with Power BI (PL-100)
Beginner
Table of contents
Ben is a Power BI & Data Specialist with a healthy interest in Microsoft Project with over 30 years of customer and implementation experience. He has been a Microsoft MVP for 13 years, is a frequent speaker at several European conferences, and blogs and creates videos on a semi-regular basis.
