
- Course
Add Interactive Features to Power BI Reports
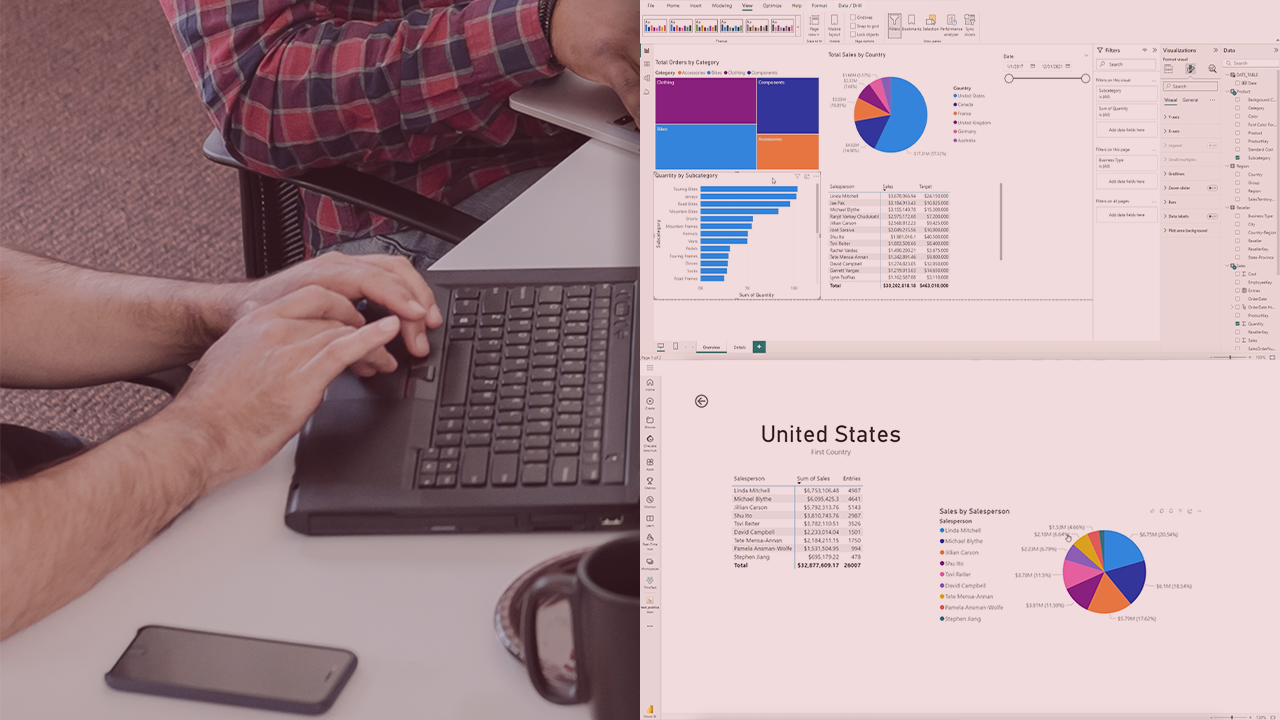
Microsoft Power BI has the features to allow users to create rich, interactive data visualization. This course will teach you to add interactive Power BI features to reports, providing a more dynamic and user-driven data exploration experience.
Intermediate
- Course
Add Interactive Features to Power BI Reports
Microsoft Power BI has the features to allow users to create rich, interactive data visualization. This course will teach you to add interactive Power BI features to reports, providing a more dynamic and user-driven data exploration experience.
Intermediate
Get started today
Access this course and other top-rated tech content with one of our business plans.
Try this course for free
Access this course and other top-rated tech content with one of our individual plans.
This course is included in the libraries shown below:
- Data
What you'll learn
Interactive features in Power BI reports allow users to explore the data themselves, which can be more engaging and insightful than static reports. This course teaches you how to create reports that allow users to filter data, drill down into details, and see different perspectives on the information. In this course, Add Interactive Features to Power BI Reports, you’ll gain the ability to enhance user understanding of data by creating a dynamic user-driven data exploration experience. First, you’ll explore connecting reports and the data they display by adding and configuring visual interactions. Next, you’ll discover the benefit of using bookmarks to enhance report storytelling. Finally, you’ll learn how to incorporate the Q&A feature for natural language queries. When you’re finished with this course, you’ll have the skills and knowledge of Power BI interactive features needed to enhance reports and create a more interactive data exploration experience for users.
Add Interactive Features to Power BI Reports
Intermediate
Table of contents
As a teenager, Tim found a love for teaching, learning, writing, and computers. He believes that everyone should be a lifelong learner. Tim has been teaching for nearly 21 years, either full or part-time. Tim is an Oracle Database Administrator with over 17 years of experience. He works out of Pittsburgh PA and lives in West Virginia with his wife and kids.
