
- Course
Summarize and Aggregate Data in R
R is a sophisticated statistical programming language. Understanding data often starts with summarization and aggregation. This course will teach you how to use R and the dplyr package to summarize and aggregate your data to gain insights.
Beginner
- Course
Summarize and Aggregate Data in R
R is a sophisticated statistical programming language. Understanding data often starts with summarization and aggregation. This course will teach you how to use R and the dplyr package to summarize and aggregate your data to gain insights.
Beginner
Get started today
Access this course and other top-rated tech content with one of our business plans.
Try this course for free
Access this course and other top-rated tech content with one of our individual plans.
This course is included in the libraries shown below:
- Data
What you'll learn
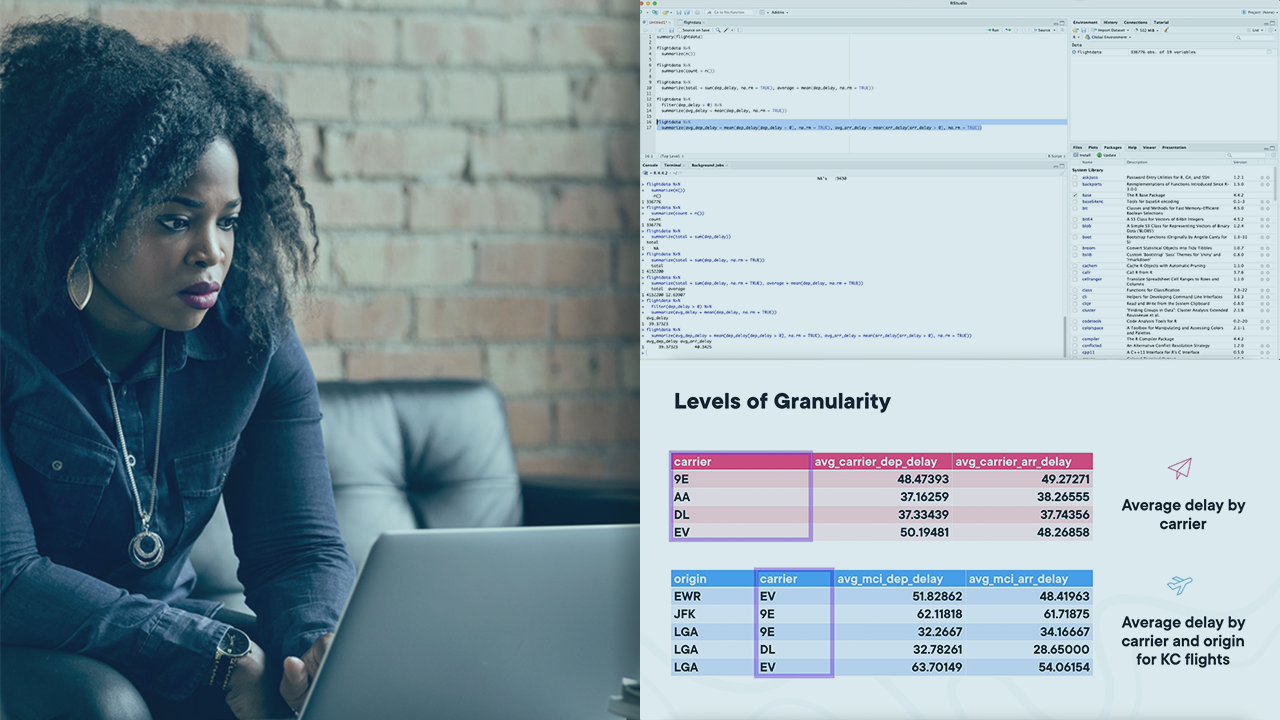
Where do you start looking for insights in your data? Summarizing and aggregating your data is an excellent way to develop a deeper understanding of your data and identify areas for further analysis. In this course, Summarize and Aggregate Data in R, you'll learn how to use R. RStudio, and the dplyr package to explore your data. First, you’ll learn how to group your data by variables. Next, you’ll discover how to apply summary functions to calculate basic statistics such as averages and sums. Finally, you’ll explore how to use grouping and nested summaries to perform multi-level aggregations and identify further insights. When you’re finished with this course, you’ll have the knowledge of R and dplyr needed to ensure that you can prepare meaningful data summaries for your next analytics project!
Summarize and Aggregate Data in R
Beginner
Table of contents
Jason Browning is a data and analytics professional with extensive experience in both the public and private sector. As a Tableau Desktop Certified Professional, Jason loves to build data visualizations that both inform and inspire.
