
- Course
Summarizing and Organizing Data in Excel
A practical and pragmatic course exploring the features of Excel that allow you to organize, summarize, analyze, and visualize large amounts of data. Quickly learn how to turn data into insightful and powerful tables and charts.
Beginner
- Course
Summarizing and Organizing Data in Excel
A practical and pragmatic course exploring the features of Excel that allow you to organize, summarize, analyze, and visualize large amounts of data. Quickly learn how to turn data into insightful and powerful tables and charts.
Beginner
Get started today
Access this course and other top-rated tech content with one of our business plans.
Try this course for free
Access this course and other top-rated tech content with one of our individual plans.
This course is included in the libraries shown below:
- Data
What you'll learn
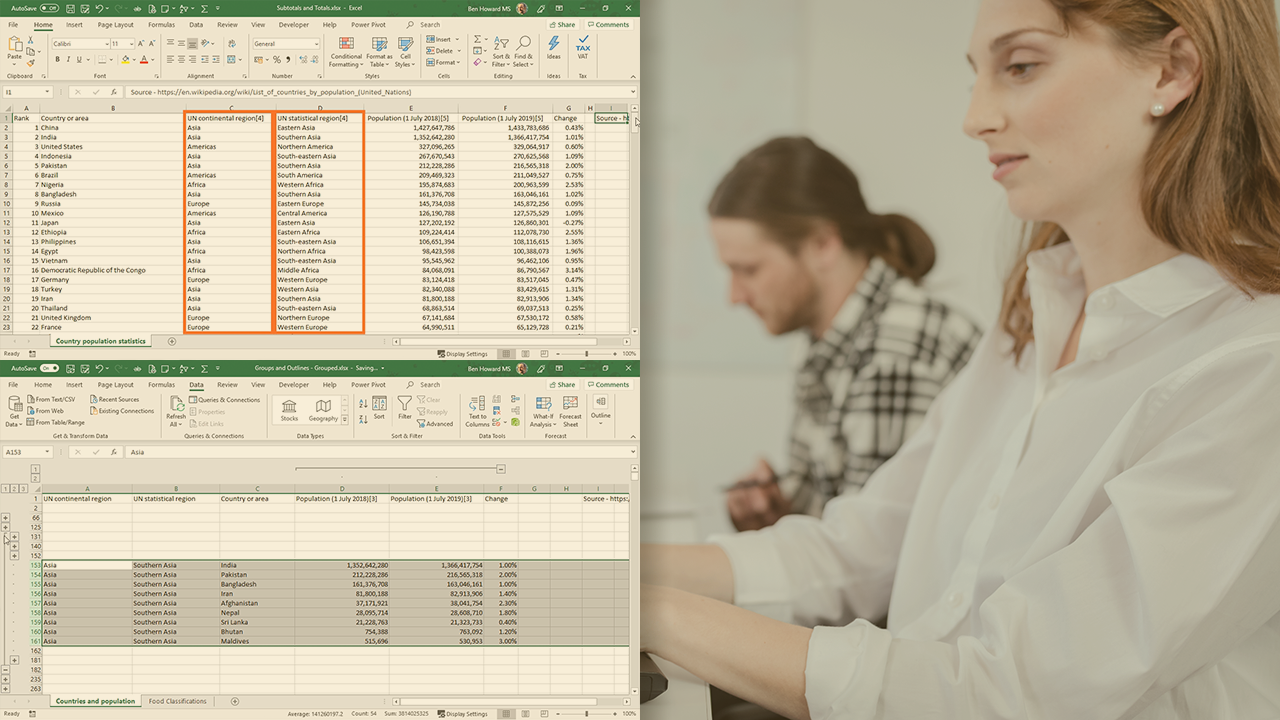
Microsoft Excel is the world’s foremost desktop application for storing, organizing, and manipulating data. This course teaches you how you can use the features of Excel to quickly organize, summarize, analyze, and visualize data so that you can understand your data and gain meaningful insights into it. First, you will learn how to order and group the data so that related items appear together. Then, you will discover how to apply totals and sub-totals to it. Finally, you will explore how to visualize the data using Conditional Formatting and Sparklines. By the end of the course, you will have the skills and knowledge to understand and visualize your own data in Excel.
Summarizing and Organizing Data in Excel
Beginner
Ben is a Power BI & Data Specialist with a healthy interest in Microsoft Project with over 30 years of customer and implementation experience. He has been a Microsoft MVP for 13 years, is a frequent speaker at several European conferences, and blogs and creates videos on a semi-regular basis.
