
- Course
Tableau Desktop Specialist - Applying Analytics to a Worksheet
Tableau is an industry leading data visualization tool. This course will teach you how to apply analytics while you are building a view.
Beginner
- Course
Tableau Desktop Specialist - Applying Analytics to a Worksheet
Tableau is an industry leading data visualization tool. This course will teach you how to apply analytics while you are building a view.
Beginner
Get started today
Access this course and other top-rated tech content with one of our business plans.
Try this course for free
Access this course and other top-rated tech content with one of our individual plans.
This course is included in the libraries shown below:
- Data
What you'll learn
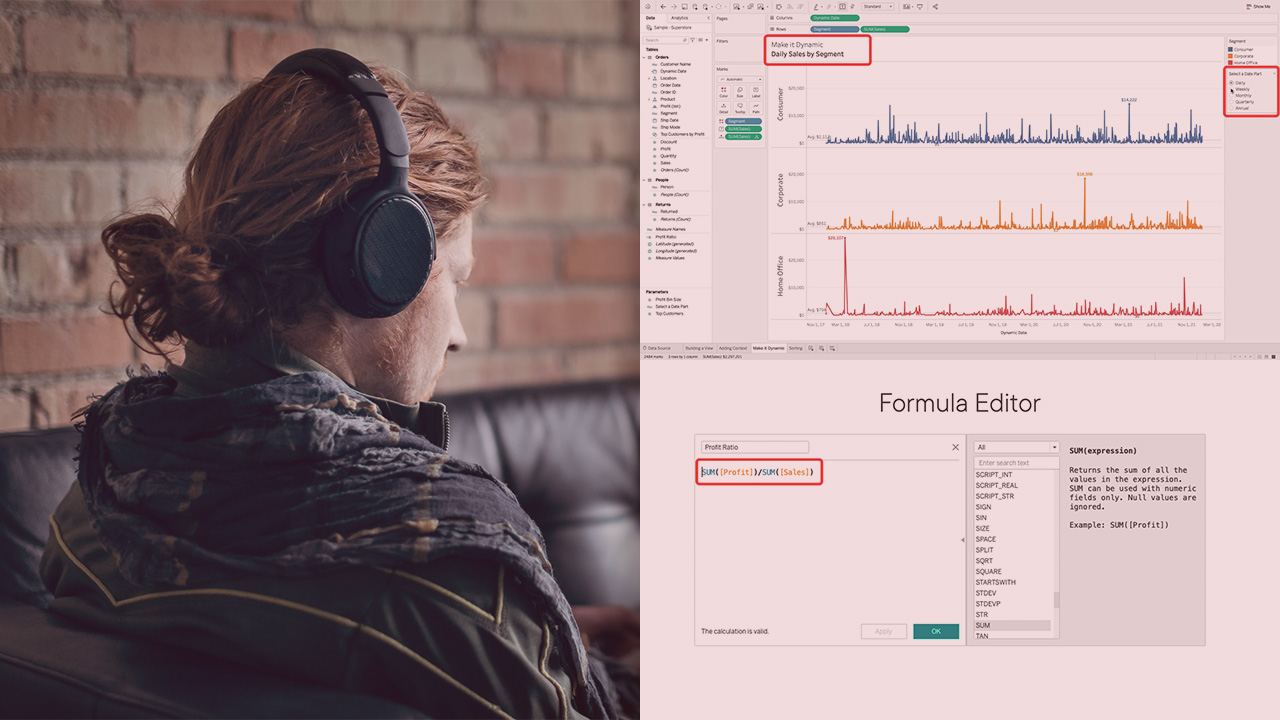
Often analysts are tasked with finding insights in a data source. In this course, Tableau Desktop Specialist - Applying Analytics to a Worksheet, you’ll learn how to explore a dataset to provide insights to your users. First, you’ll explore building a basic view. Next, you’ll discover how to add context to the view using reference lines. Finally, you’ll learn how to make your view dynamic using parameters. When you’re finished with this course, you’ll have the skills and knowledge of applying analytics to a worksheet needed to effectively communicate insights to your users.
Tableau Desktop Specialist - Applying Analytics to a Worksheet
Beginner
Table of contents
Adam Crahen is the Director of Analytics Practices and Enablement for Pluralsight and also a former Tableau Zen Master. Adam is a creative problem solver specializing in data curation, transformation and visualization with tools like Tableau, SQL, Snowflake, dbt, and Alteryx, etc. His work has been recognized by organizations like Kantar and has been featured by several news organizations around the world. He enjoys sharing his knowledge and passion for data by speaking at conferences, user groups and connecting with the data community.
