- Course
Tableau Desktop Specialist - Creating and Modifying a Dashboard
Tableau is an industry leading data visualization tool. This course will teach you how to put all your analysis together so you can present your analysis effectively.

- Course
Tableau Desktop Specialist - Creating and Modifying a Dashboard
Tableau is an industry leading data visualization tool. This course will teach you how to put all your analysis together so you can present your analysis effectively.
Get started today
Access this course and other top-rated tech content with one of our business plans.
Try this course for free
Access this course and other top-rated tech content with one of our individual plans.
This course is included in the libraries shown below:
- Data
What you'll learn
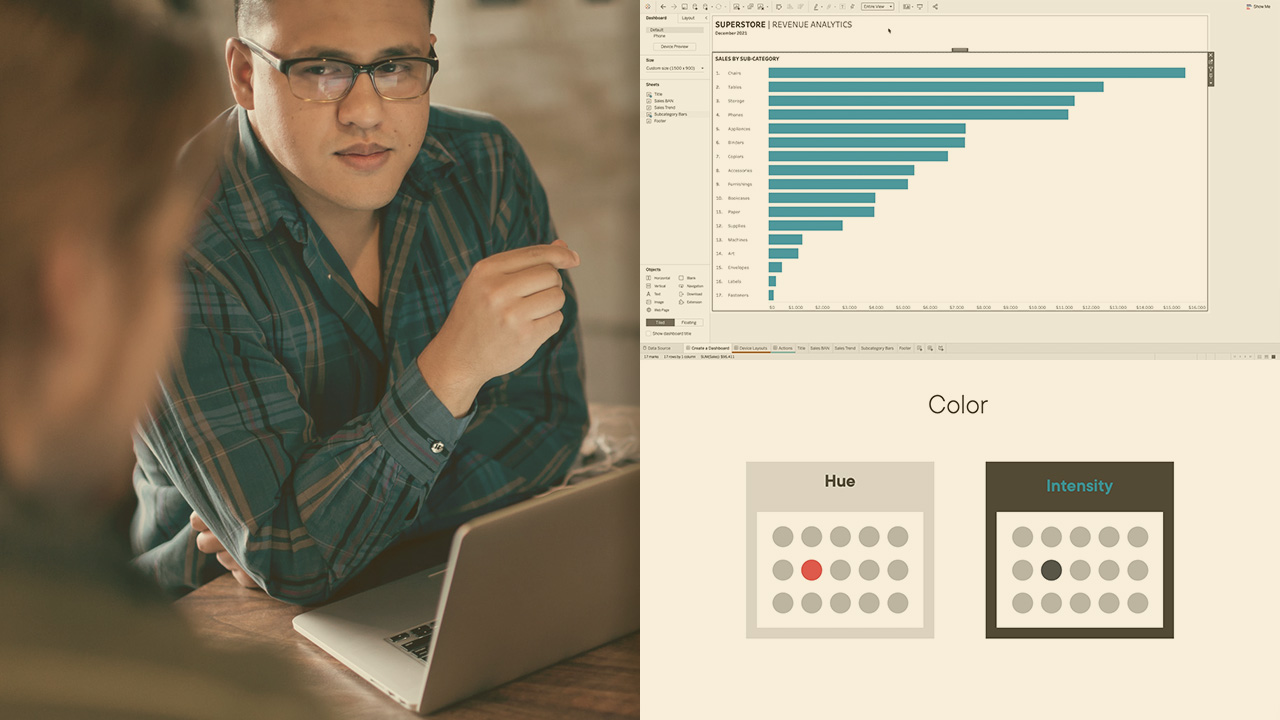
Presenting data effectively is an art. In this course, Tableau Desktop Specialist - Creating and Modifying a Dashboard, you’ll learn to create effective dashboards and stories of your analysis. First, you’ll explore the science of data visualization. Next, you’ll discover how to build a dashboard for multiple devices. Finally, you’ll learn how to add interactivity for your users to find answers to their own questions. When you’re finished with this course, you’ll have the skills and knowledge of creating dashboards needed to effectively communicate with data.

